|
Download Data (XLS File) |
|
||||||||
|
||||||||
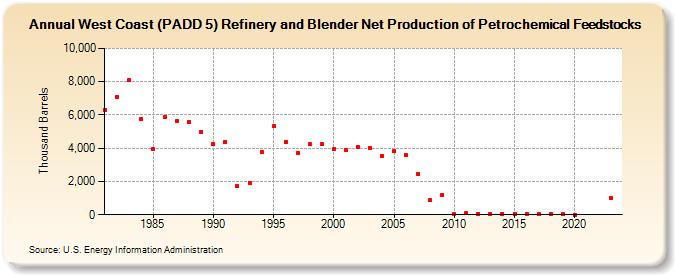
| West Coast (PADD 5) Refinery and Blender Net Production of Petrochemical Feedstocks (Thousand Barrels) | ||||||||
| Decade | Year-0 | Year-1 | Year-2 | Year-3 | Year-4 | Year-5 | Year-6 | Year-7 | Year-8 | Year-9 |
|---|---|---|---|---|---|---|---|---|---|---|
| 1980's | 6,313 | 7,081 | 8,072 | 5,745 | 3,950 | 5,852 | 5,624 | 5,583 | 5,003 | |
| 1990's | 4,228 | 4,389 | 1,703 | 1,913 | 3,795 | 5,318 | 4,370 | 3,734 | 4,263 | 4,240 |
| 2000's | 3,944 | 3,861 | 4,077 | 4,037 | 3,559 | 3,808 | 3,591 | 2,460 | 883 | 1,205 |
| 2010's | 57 | 76 | 66 | 60 | 72 | 64 | 44 | 34 | 29 | 24 |
| 2020's | 2 | 984 |
| - = No Data Reported; -- = Not Applicable; NA = Not Available; W = Withheld to avoid disclosure of individual company data. |
| Release Date: 3/29/2024 |
| Next Release Date: 8/30/2024 |