|
Download Data (XLS File) |
|
||||||||
|
||||||||
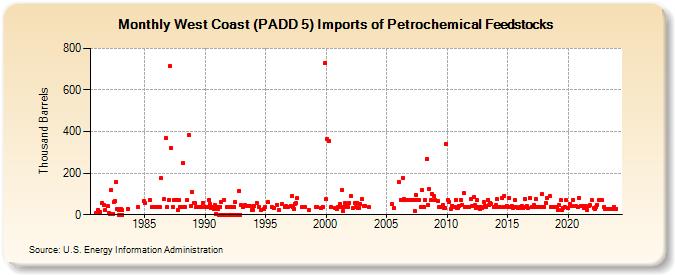
| West Coast (PADD 5) Imports of Petrochemical Feedstocks (Thousand Barrels) | ||||||||
| Year | Jan | Feb | Mar | Apr | May | Jun | Jul | Aug | Sep | Oct | Nov | Dec |
|---|---|---|---|---|---|---|---|---|---|---|---|---|
| 1981 | 7 | 22 | 15 | 58 | 47 | 22 | ||||||
| 1982 | 40 | 6 | 4 | 119 | 3 | 5 | 63 | 65 | 159 | 29 | 22 | 1 |
| 1983 | 29 | 22 | 1 | 28 | ||||||||
| 1984 | 36 | 64 | ||||||||||
| 1985 | 56 | 72 | 36 | 37 | 36 | |||||||
| 1986 | 37 | 36 | 37 | 175 | 74 | 368 | 36 | |||||
| 1987 | 72 | 713 | 323 | 36 | 72 | 72 | 22 | 73 | 36 | |||
| 1988 | 37 | 250 | 37 | 36 | 73 | 382 | 42 | 109 | ||||
| 1989 | 54 | 54 | 35 | 36 | 36 | 36 | 36 | 58 | ||||
| 1990 | 37 | 36 | 36 | 72 | 51 | 30 | 35 | 29 | 45 | 4 | ||
| 1991 | 37 | 29 | 0 | 38 | 59 | 0 | 0 | 71 | 0 | 0 | 36 | 0 |
| 1992 | 35 | 38 | 0 | 37 | 0 | 36 | 60 | 0 | 0 | 0 | 116 | 0 |
| 1993 | 45 | 38 | 45 | 42 | 43 | 21 | 21 | |||||
| 1994 | 43 | 58 | 37 | 21 | 28 | 36 | ||||||
| 1995 | 59 | 37 | 34 | 49 | ||||||||
| 1996 | 23 | 51 | 37 | 40 | 37 | |||||||
| 1997 | 42 | 89 | 37 | 29 | 53 | 54 | 80 | |||||
| 1998 | 37 | 38 | 24 | |||||||||
| 1999 | 36 | 37 | 34 | 38 | 728 | |||||||
| 2000 | 74 | 364 | 353 | 38 | 34 | 28 | ||||||
| 2001 | 36 | 52 | 38 | 121 | 19 | 38 | 56 | 53 | 38 | 57 | ||
| 2002 | 88 | 33 | 54 | 38 | 57 | 34 | 34 | 52 | ||||
| 2003 | 75 | 43 | 41 | 35 | ||||||||
| 2005 | 51 | 30 | ||||||||||
| 2006 | 158 | 72 | 177 | 74 | 72 | 72 | 69 | 69 | ||||
| 2007 | 69 | 73 | 17 | 95 | 72 | 73 | 38 | 118 | ||||
| 2008 | 37 | 72 | 269 | 49 | 124 | 69 | 101 | 91 | ||||
| 2009 | 69 | 65 | 36 | 36 | 48 | 34 | 34 | 342 | ||||
| 2010 | 72 | 63 | 29 | 44 | 36 | 38 | 36 | 72 | 34 | 34 | ||
| 2011 | 43 | 72 | 48 | 103 | 36 | 36 | 35 | 36 | ||||
| 2012 | 76 | 43 | 83 | 48 | 34 | 70 | 36 | 36 | 29 | 36 | 34 | |
| 2013 | 59 | 43 | 39 | 72 | 48 | 58 | 53 | 38 | ||||
| 2014 | 37 | 45 | 74 | 36 | 36 | 37 | 79 | 39 | 92 | 44 | ||
| 2015 | 37 | 82 | 38 | 43 | 34 | 37 | 72 | 38 | 34 | 34 | ||
| 2016 | 36 | 35 | 41 | 34 | 77 | 38 | 41 | 34 | 80 | |||
| 2017 | 37 | 37 | 45 | 36 | 74 | 38 | 38 | 38 | 99 | |||
| 2018 | 38 | 58 | 80 | 91 | 38 | 35 | 38 | |||||
| 2019 | 38 | 38 | 22 | 45 | 70 | 22 | 34 | 35 | 69 | |||
| 2020 | 34 | 51 | 41 | 73 | 43 | 37 | 80 | |||||
| 2021 | 44 | 44 | 32 | 43 | 34 | 22 | 42 | 46 | ||||
| 2022 | 69 | 30 | 28 | 35 | 48 | 70 | 69 | |||||
| 2023 | 38 | 28 | 28 | 29 | 28 | 27 | 28 | 29 | 38 | |||
| 2024 | 29 | |||||||||||
| - = No Data Reported; -- = Not Applicable; NA = Not Available; W = Withheld to avoid disclosure of individual company data. |
| Release Date: 3/29/2024 |
| Next Release Date: 4/30/2024 |