|
Download Data (XLS File) |
|
||||||||
|
||||||||
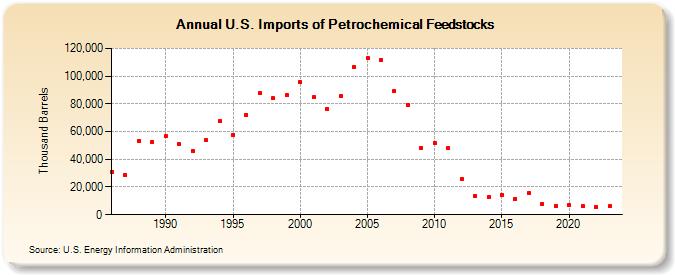
| U.S. Imports of Petrochemical Feedstocks (Thousand Barrels) | ||||||||
| Decade | Year-0 | Year-1 | Year-2 | Year-3 | Year-4 | Year-5 | Year-6 | Year-7 | Year-8 | Year-9 |
|---|---|---|---|---|---|---|---|---|---|---|
| 1980's | 31,002 | 28,885 | 53,541 | 52,582 | ||||||
| 1990's | 56,561 | 50,834 | 45,985 | 53,629 | 67,748 | 57,737 | 72,261 | 87,767 | 83,942 | 86,176 |
| 2000's | 95,695 | 84,738 | 76,414 | 85,331 | 106,604 | 113,157 | 111,709 | 89,163 | 79,087 | 48,337 |
| 2010's | 51,942 | 47,954 | 26,092 | 13,433 | 12,506 | 14,428 | 11,620 | 15,696 | 7,855 | 6,128 |
| 2020's | 6,790 | 6,134 | 5,739 | 5,967 |
| - = No Data Reported; -- = Not Applicable; NA = Not Available; W = Withheld to avoid disclosure of individual company data. |
| Release Date: 8/30/2024 |
| Next Release Date: 8/29/2025 |