|
Download Data (XLS File) |
|
||||||||
|
||||||||
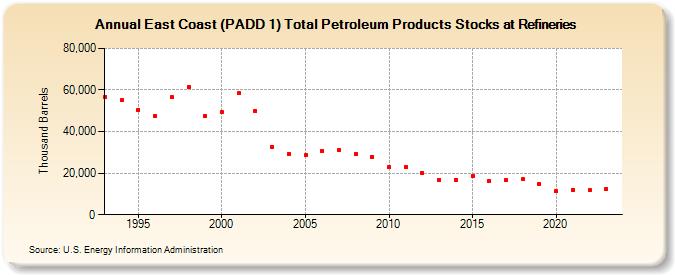
| East Coast (PADD 1) Total Petroleum Products Stocks at Refineries (Thousand Barrels) | ||||||||
| Decade | Year-0 | Year-1 | Year-2 | Year-3 | Year-4 | Year-5 | Year-6 | Year-7 | Year-8 | Year-9 |
|---|---|---|---|---|---|---|---|---|---|---|
| 1990's | 56,858 | 55,022 | 50,550 | 47,387 | 56,576 | 61,529 | 47,375 | |||
| 2000's | 49,455 | 58,376 | 49,995 | 32,809 | 29,259 | 28,504 | 30,835 | 30,946 | 29,392 | 27,940 |
| 2010's | 22,919 | 23,016 | 20,181 | 16,921 | 16,806 | 18,647 | 15,979 | 16,662 | 16,992 | 14,817 |
| 2020's | 11,284 | 12,065 | 11,743 | 12,264 |
| - = No Data Reported; -- = Not Applicable; NA = Not Available; W = Withheld to avoid disclosure of individual company data. |
| Release Date: 3/29/2024 |
| Next Release Date: 8/30/2024 |