|
Download Data (XLS File) |
|
||||||||
|
||||||||
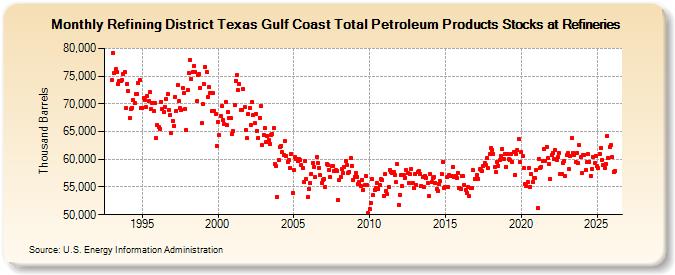
| Refining District Texas Gulf Coast Total Petroleum Products Stocks at Refineries (Thousand Barrels) | ||||||||
| Year | Jan | Feb | Mar | Apr | May | Jun | Jul | Aug | Sep | Oct | Nov | Dec |
|---|---|---|---|---|---|---|---|---|---|---|---|---|
| 1993 | 74,367 | 79,248 | 75,568 | 76,225 | 75,771 | 73,526 | 74,153 | 74,092 | 74,365 | 75,445 | 75,759 | 69,174 |
| 1994 | 73,634 | 72,273 | 67,447 | 69,116 | 69,315 | 70,719 | 70,068 | 71,795 | 71,776 | 73,693 | 74,224 | 69,221 |
| 1995 | 69,327 | 71,008 | 70,759 | 69,381 | 71,421 | 70,476 | 72,070 | 69,092 | 70,075 | 68,669 | 70,066 | 63,790 |
| 1996 | 66,184 | 65,771 | 65,511 | 70,416 | 69,126 | 68,441 | 69,475 | 70,876 | 71,701 | 68,972 | 68,032 | 64,772 |
| 1997 | 66,987 | 66,063 | 71,190 | 68,751 | 73,373 | 70,425 | 69,238 | 68,896 | 72,781 | 72,029 | 69,046 | 65,253 |
| 1998 | 72,518 | 75,514 | 77,906 | 74,482 | 75,754 | 76,871 | 75,749 | 70,436 | 75,261 | 75,411 | 72,942 | 66,525 |
| 1999 | 69,918 | 73,512 | 76,705 | 75,822 | 71,219 | 72,979 | 71,999 | 68,682 | 71,871 | 68,782 | 68,178 | 62,428 |
| 2000 | 66,758 | 64,292 | 67,891 | 69,544 | 67,072 | 66,323 | 70,391 | 66,122 | 68,482 | 67,421 | 67,533 | 64,593 |
| 2001 | 65,056 | 69,816 | 74,174 | 75,218 | 72,480 | 73,550 | 68,861 | 68,936 | 72,622 | 69,360 | 65,311 | 63,778 |
| 2002 | 68,221 | 69,305 | 66,259 | 70,260 | 67,921 | 66,530 | 68,217 | 65,161 | 63,895 | 67,510 | 69,537 | 62,513 |
| 2003 | 64,412 | 65,568 | 63,080 | 64,210 | 63,473 | 62,834 | 64,458 | 64,619 | 65,601 | 59,111 | 58,698 | 53,263 |
| 2004 | 59,955 | 62,219 | 62,448 | 61,260 | 60,686 | 63,208 | 60,673 | 59,535 | 59,825 | 58,466 | 61,027 | 53,959 |
| 2005 | 58,082 | 60,392 | 60,027 | 59,636 | 60,103 | 59,865 | 58,981 | 58,401 | 55,816 | 59,759 | 56,421 | 53,118 |
| 2006 | 54,656 | 55,695 | 57,419 | 59,358 | 58,611 | 56,788 | 60,391 | 59,283 | 58,484 | 57,099 | 55,740 | 56,186 |
| 2007 | 56,400 | 55,081 | 59,061 | 58,889 | 58,128 | 56,727 | 58,730 | 58,746 | 57,845 | 58,012 | 57,875 | 52,699 |
| 2008 | 56,325 | 56,853 | 58,221 | 57,457 | 58,674 | 59,725 | 59,000 | 57,550 | 57,790 | 60,190 | 58,805 | 56,258 |
| 2009 | 56,854 | 57,523 | 56,774 | 55,588 | 55,925 | 55,228 | 56,327 | 54,466 | 55,307 | 56,985 | 55,292 | 50,220 |
| 2010 | 51,000 | 52,130 | 56,509 | 53,572 | 54,539 | 54,886 | 55,709 | 54,638 | 55,342 | 56,402 | 56,186 | 53,444 |
| 2011 | 57,291 | 54,289 | 53,697 | 55,000 | 58,140 | 57,682 | 57,501 | 57,717 | 57,140 | 55,819 | 59,075 | 51,821 |
| 2012 | 53,591 | 57,146 | 55,136 | 57,089 | 56,679 | 58,053 | 57,474 | 55,784 | 57,317 | 58,268 | 55,698 | 54,789 |
| 2013 | 57,375 | 55,415 | 57,685 | 57,822 | 57,373 | 55,234 | 56,768 | 55,032 | 56,997 | 56,674 | 55,728 | 53,343 |
| 2014 | 57,382 | 55,898 | 56,540 | 56,827 | 55,753 | 54,569 | 54,207 | 55,586 | 56,025 | 57,349 | 59,591 | 54,790 |
| 2015 | 54,932 | 56,775 | 55,031 | 57,081 | 57,066 | 57,021 | 58,694 | 56,831 | 57,030 | 56,624 | 57,544 | 54,872 |
| 2016 | 54,628 | 56,988 | 56,893 | 55,376 | 54,503 | 53,861 | 54,965 | 53,397 | 54,759 | 54,905 | 58,046 | 56,467 |
| 2017 | 56,508 | 57,216 | 56,493 | 58,163 | 58,097 | 57,796 | 58,738 | 59,370 | 58,880 | 60,247 | 58,410 | 60,873 |
| 2018 | 62,009 | 61,727 | 61,005 | 58,653 | 57,781 | 59,551 | 58,771 | 59,813 | 60,660 | 61,810 | 60,136 | 60,975 |
| 2019 | 58,634 | 61,021 | 59,980 | 59,809 | 60,985 | 59,584 | 61,318 | 57,253 | 60,933 | 61,757 | 63,639 | 59,452 |
| 2020 | 61,271 | 60,523 | 58,346 | 55,463 | 55,188 | 55,910 | 58,508 | 55,067 | 57,386 | 55,886 | 56,689 | 56,558 |
| 2021 | 58,110 | 51,184 | 60,073 | 58,460 | 58,633 | 59,675 | 61,864 | 59,711 | 62,205 | 60,216 | 59,089 | 56,506 |
| 2022 | 60,743 | 61,198 | 60,082 | 61,671 | 59,956 | 60,356 | 61,108 | 57,347 | 57,366 | 59,299 | 59,670 | 56,946 |
| 2023 | 60,717 | 61,115 | 58,344 | 60,558 | 63,859 | 61,153 | 60,787 | 59,506 | 61,026 | 59,300 | 62,449 | 60,411 |
| 2024 | 57,522 | |||||||||||
| - = No Data Reported; -- = Not Applicable; NA = Not Available; W = Withheld to avoid disclosure of individual company data. |
| Release Date: 3/29/2024 |
| Next Release Date: 4/30/2024 |
Referring Pages: