|
Download Data (XLS File) |
|
||||||||
|
||||||||
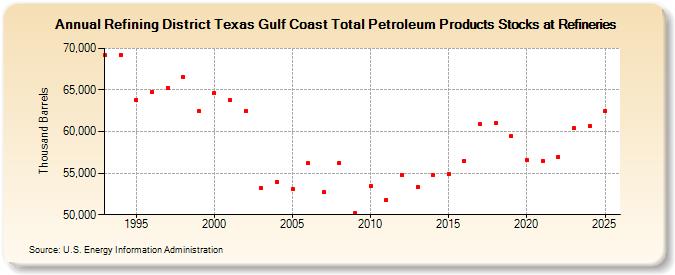
| Refining District Texas Gulf Coast Total Petroleum Products Stocks at Refineries (Thousand Barrels) | ||||||||
| Decade | Year-0 | Year-1 | Year-2 | Year-3 | Year-4 | Year-5 | Year-6 | Year-7 | Year-8 | Year-9 |
|---|---|---|---|---|---|---|---|---|---|---|
| 1990's | 69,174 | 69,221 | 63,790 | 64,772 | 65,253 | 66,525 | 62,428 | |||
| 2000's | 64,593 | 63,778 | 62,513 | 53,263 | 53,959 | 53,118 | 56,186 | 52,699 | 56,258 | 50,220 |
| 2010's | 53,444 | 51,821 | 54,789 | 53,343 | 54,790 | 54,872 | 56,467 | 60,873 | 60,975 | 59,452 |
| 2020's | 56,558 | 56,506 | 56,946 | 60,411 |
| - = No Data Reported; -- = Not Applicable; NA = Not Available; W = Withheld to avoid disclosure of individual company data. |
| Release Date: 3/29/2024 |
| Next Release Date: 8/30/2024 |
Referring Pages: