|
Download Data (XLS File) |
|
||||||||
|
||||||||
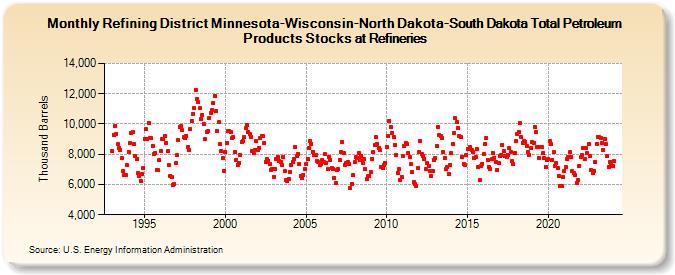
| Refining District Minnesota-Wisconsin-North Dakota-South Dakota Total Petroleum Products Stocks at Refineries (Thousand Barrels) | ||||||||
| Year | Jan | Feb | Mar | Apr | May | Jun | Jul | Aug | Sep | Oct | Nov | Dec |
|---|---|---|---|---|---|---|---|---|---|---|---|---|
| 1993 | 8,186 | 9,291 | 9,838 | 9,343 | 8,645 | 8,385 | 8,255 | 7,757 | 6,864 | 6,622 | 6,655 | 7,261 |
| 1994 | 8,115 | 8,756 | 9,379 | 9,482 | 8,674 | 7,886 | 7,671 | 6,756 | 6,528 | 6,237 | 6,723 | 7,062 |
| 1995 | 9,006 | 9,658 | 8,982 | 10,070 | 9,052 | 9,041 | 8,576 | 8,023 | 8,073 | 6,977 | 6,931 | 7,599 |
| 1996 | 8,212 | 8,983 | 9,009 | 9,193 | 8,765 | 8,182 | 7,288 | 6,585 | 6,464 | 5,982 | 6,057 | 7,398 |
| 1997 | 7,957 | 8,911 | 9,784 | 9,838 | 9,571 | 9,118 | 9,049 | 9,235 | 8,510 | 8,296 | 9,654 | 10,195 |
| 1998 | 10,689 | 11,024 | 12,245 | 11,682 | 11,440 | 11,033 | 10,342 | 10,602 | 10,006 | 8,998 | 9,471 | 9,514 |
| 1999 | 10,397 | 10,752 | 10,930 | 11,415 | 11,844 | 10,843 | 9,528 | 10,108 | 8,656 | 8,244 | 7,719 | 6,915 |
| 2000 | 8,153 | 8,750 | 9,503 | 9,528 | 9,493 | 9,040 | 9,127 | 8,154 | 7,623 | 7,286 | 7,444 | 7,943 |
| 2001 | 8,816 | 8,848 | 9,114 | 9,733 | 9,906 | 9,500 | 9,318 | 9,121 | 8,212 | 8,072 | 8,299 | 8,867 |
| 2002 | 8,293 | 8,424 | 9,077 | 9,219 | 9,176 | 8,752 | 7,512 | 7,661 | 7,573 | 7,369 | 6,977 | 7,033 |
| 2003 | 6,526 | 7,043 | 7,696 | 7,806 | 7,556 | 7,516 | 7,257 | 7,832 | 6,890 | 6,311 | 6,259 | 6,393 |
| 2004 | 6,849 | 7,299 | 7,484 | 7,701 | 8,467 | 7,880 | 8,033 | 7,357 | 6,579 | 6,402 | 6,633 | 7,012 |
| 2005 | 7,331 | 7,681 | 8,386 | 8,866 | 8,707 | 8,179 | 7,977 | 7,960 | 7,536 | 7,474 | 7,274 | 7,361 |
| 2006 | 7,605 | 7,500 | 8,015 | 7,417 | 7,030 | 7,828 | 7,613 | 7,069 | 7,053 | 6,459 | 6,080 | 6,957 |
| 2007 | 7,039 | 7,617 | 8,171 | 8,806 | 8,068 | 7,257 | 7,411 | 7,504 | 7,351 | 5,771 | 6,064 | 6,604 |
| 2008 | 7,457 | 7,787 | 7,740 | 8,074 | 7,585 | 7,890 | 7,432 | 7,710 | 7,011 | 6,377 | 6,569 | 6,574 |
| 2009 | 6,835 | 7,698 | 8,177 | 8,608 | 9,131 | 8,687 | 8,407 | 8,261 | 7,172 | 7,084 | 7,278 | 7,406 |
| 2010 | 8,502 | 9,210 | 10,213 | 9,823 | 9,435 | 9,150 | 8,623 | 7,973 | 6,759 | 7,006 | 6,321 | 6,515 |
| 2011 | 7,852 | 8,566 | 8,770 | 8,695 | 8,085 | 7,827 | 7,333 | 6,841 | 6,152 | 6,020 | 5,881 | 7,079 |
| 2012 | 8,152 | 8,874 | 8,006 | 7,877 | 7,696 | 7,042 | 7,441 | 7,211 | 6,893 | 6,558 | 6,885 | 7,611 |
| 2013 | 7,726 | 8,552 | 9,802 | 9,287 | 9,182 | 9,082 | 8,123 | 7,744 | 7,003 | 7,154 | 6,722 | 7,278 |
| 2014 | 8,075 | 8,701 | 9,398 | 10,371 | 10,106 | 9,755 | 9,227 | 9,163 | 7,823 | 7,376 | 7,279 | 7,963 |
| 2015 | 8,341 | 8,354 | 8,486 | 8,288 | 8,167 | 7,724 | 7,819 | 8,356 | 7,169 | 6,272 | 7,194 | 7,384 |
| 2016 | 7,994 | 8,704 | 9,090 | 7,613 | 7,164 | 7,043 | 7,658 | 8,062 | 7,777 | 7,493 | 6,971 | 7,410 |
| 2017 | 7,884 | 7,961 | 8,630 | 8,184 | 7,870 | 7,846 | 7,929 | 8,394 | 8,169 | 7,534 | 7,345 | 8,065 |
| 2018 | 8,857 | 9,346 | 9,475 | 10,053 | 9,152 | 8,757 | 8,862 | 8,821 | 8,553 | 8,148 | 7,979 | 8,419 |
| 2019 | 8,782 | 8,771 | 9,780 | 9,440 | 8,491 | 7,753 | 8,457 | 8,461 | 8,070 | 7,726 | 7,171 | 7,614 |
| 2020 | 7,699 | 8,855 | 8,675 | 7,636 | 8,141 | 7,238 | 7,428 | 7,077 | 6,566 | 5,918 | 5,913 | 6,473 |
| 2021 | 6,917 | 7,168 | 7,694 | 7,797 | 8,127 | 7,821 | 6,894 | 6,728 | 6,622 | 6,104 | 6,275 | 7,243 |
| 2022 | 7,812 | 7,940 | 8,410 | 7,693 | 8,426 | 8,066 | 8,661 | 7,867 | 6,964 | 6,767 | 6,923 | 7,511 |
| 2023 | 8,705 | 9,162 | 9,129 | 9,078 | 8,766 | 8,255 | 9,031 | 8,676 | 7,873 | 7,158 | 7,511 | 7,295 |
| 2024 | 7,209 | |||||||||||
| - = No Data Reported; -- = Not Applicable; NA = Not Available; W = Withheld to avoid disclosure of individual company data. |
| Release Date: 3/29/2024 |
| Next Release Date: 4/30/2024 |