|
Download Data (XLS File) |
|
||||||||
|
||||||||
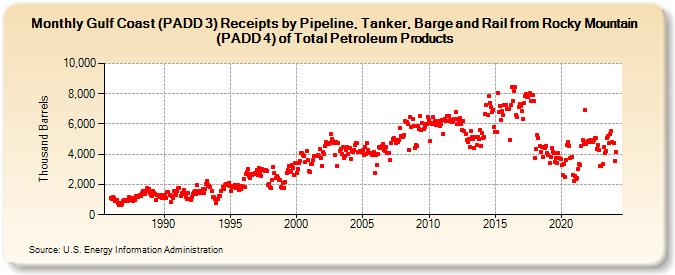
| Gulf Coast (PADD 3) Receipts by Pipeline, Tanker, Barge and Rail from Rocky Mountain (PADD 4) of Total Petroleum Products (Thousand Barrels) | ||||||||
| Year | Jan | Feb | Mar | Apr | May | Jun | Jul | Aug | Sep | Oct | Nov | Dec |
|---|---|---|---|---|---|---|---|---|---|---|---|---|
| 1986 | 1,124 | 1,070 | 1,165 | 1,077 | 928 | 978 | 742 | 649 | 763 | 675 | 709 | 926 |
| 1987 | 944 | 913 | 956 | 897 | 1,156 | 1,043 | 998 | 1,078 | 905 | 1,011 | 997 | 1,241 |
| 1988 | 1,155 | 1,259 | 1,335 | 1,249 | 1,427 | 1,561 | 1,358 | 1,376 | 1,578 | 1,752 | 1,687 | 1,462 |
| 1989 | 1,314 | 1,231 | 1,557 | 1,447 | 1,374 | 1,002 | 1,314 | 1,250 | 1,170 | 1,299 | 1,102 | 1,148 |
| 1990 | 1,205 | 1,330 | 1,093 | 1,491 | 1,493 | 1,302 | 835 | 1,243 | 1,121 | 1,585 | 1,319 | 1,320 |
| 1991 | 1,550 | 1,793 | 1,773 | 1,208 | 1,441 | 1,383 | 1,629 | 1,467 | 1,149 | 1,030 | 1,417 | 1,065 |
| 1992 | 958 | 1,187 | 1,396 | 1,512 | 1,555 | 1,354 | 1,963 | 1,451 | 1,579 | 1,580 | 1,454 | 1,706 |
| 1993 | 1,423 | 1,679 | 2,033 | 2,246 | 1,982 | 1,924 | 1,823 | 1,537 | 1,142 | 1,158 | 1,064 | 806 |
| 1994 | 1,024 | 1,071 | 1,236 | 1,265 | 1,582 | 1,849 | 1,717 | 1,941 | 2,014 | 1,990 | 2,023 | 2,120 |
| 1995 | 1,930 | 1,556 | 1,864 | 1,869 | 1,988 | 1,754 | 1,760 | 1,952 | 1,609 | 1,892 | 1,715 | 1,920 |
| 1996 | 2,393 | 1,838 | 2,693 | 2,821 | 2,993 | 2,554 | 2,424 | 2,694 | 2,623 | 2,709 | 2,747 | 2,721 |
| 1997 | 2,985 | 2,607 | 3,107 | 2,819 | 2,569 | 3,016 | 2,925 | 2,872 | 2,953 | 2,902 | 1,987 | 2,055 |
| 1998 | 1,835 | 1,737 | 2,317 | 3,155 | 2,760 | 2,405 | 2,547 | 2,435 | 2,271 | 2,270 | 1,807 | 1,743 |
| 1999 | 2,077 | 1,786 | 2,151 | 2,762 | 2,961 | 3,209 | 2,840 | 2,906 | 3,270 | 3,075 | 2,641 | 3,443 |
| 2000 | 2,783 | 3,024 | 3,430 | 3,577 | 4,098 | 4,050 | 3,947 | 3,903 | 3,502 | 4,214 | 3,629 | 2,916 |
| 2001 | 2,840 | 3,364 | 3,356 | 3,590 | 3,874 | 3,908 | 3,852 | 3,937 | 3,872 | 4,328 | 3,774 | 3,247 |
| 2002 | 4,159 | 4,043 | 4,522 | 4,809 | 4,703 | 4,675 | 4,770 | 5,315 | 4,985 | 4,875 | 4,739 | 3,970 |
| 2003 | 4,815 | 3,203 | 4,751 | 4,214 | 4,374 | 4,023 | 4,450 | 3,770 | 3,915 | 4,256 | 4,457 | 4,016 |
| 2004 | 4,425 | 3,715 | 4,218 | 4,161 | 4,299 | 4,633 | 4,743 | 4,718 | 4,178 | 4,190 | 4,169 | 4,165 |
| 2005 | 4,272 | 3,952 | 4,469 | 4,010 | 4,757 | 4,269 | 4,071 | 4,063 | 3,922 | 3,959 | 4,154 | 2,751 |
| 2006 | 3,925 | 3,320 | 4,045 | 4,501 | 4,391 | 4,552 | 4,652 | 4,257 | 4,217 | 4,455 | 4,083 | 4,112 |
| 2007 | 4,072 | 3,633 | 4,761 | 4,997 | 5,101 | 4,958 | 4,743 | 4,948 | 4,806 | 4,956 | 5,705 | 5,184 |
| 2008 | 5,153 | 5,239 | 6,175 | 6,146 | 6,128 | 6,016 | 4,279 | 6,483 | 5,810 | 6,352 | 5,879 | 4,412 |
| 2009 | 4,596 | 4,515 | 5,839 | 5,673 | 6,500 | 5,580 | 6,060 | 5,672 | 5,817 | 6,015 | 5,974 | 6,492 |
| 2010 | 6,274 | 4,866 | 6,048 | 5,984 | 6,429 | 6,185 | 5,944 | 6,064 | 6,044 | 6,167 | 5,880 | 5,989 |
| 2011 | 6,234 | 5,363 | 6,342 | 6,181 | 6,512 | 6,206 | 6,542 | 6,232 | 6,237 | 6,140 | 6,214 | 6,328 |
| 2012 | 6,787 | 5,968 | 6,307 | 6,102 | 6,409 | 6,013 | 5,597 | 6,207 | 5,508 | 5,360 | 4,909 | 4,782 |
| 2013 | 5,018 | 4,495 | 5,540 | 5,124 | 5,011 | 4,411 | 5,158 | 4,610 | 5,168 | 4,994 | 5,632 | 4,574 |
| 2014 | 5,420 | 5,061 | 5,137 | 6,683 | 7,246 | 6,601 | 7,829 | 7,388 | 7,116 | 6,787 | 6,949 | 5,802 |
| 2015 | 5,483 | 5,455 | 8,075 | 6,778 | 7,191 | 6,274 | 6,837 | 6,599 | 7,281 | 7,227 | 7,280 | 7,003 |
| 2016 | 7,006 | 4,952 | 7,228 | 8,436 | 7,492 | 8,149 | 8,434 | 6,611 | 6,435 | 7,139 | 7,322 | 7,189 |
| 2017 | 6,854 | 6,314 | 7,371 | 7,870 | 7,961 | 7,754 | 7,771 | 8,025 | 7,500 | 7,924 | 7,899 | 7,487 |
| 2018 | 3,763 | 4,359 | 5,248 | 5,069 | 4,525 | 4,145 | 4,504 | 3,809 | 4,481 | 4,423 | 4,574 | 4,072 |
| 2019 | 3,941 | 3,451 | 3,795 | 4,424 | 4,174 | 4,061 | 3,517 | 3,732 | 3,421 | 4,048 | 3,743 | 3,684 |
| 2020 | 3,298 | 2,605 | 3,373 | 2,481 | 3,637 | 4,611 | 4,782 | 4,544 | 3,780 | 3,810 | 2,644 | 2,262 |
| 2021 | 2,551 | 2,379 | 2,423 | 3,028 | 3,383 | 3,274 | 4,563 | 4,922 | 4,652 | 6,918 | 4,700 | 4,829 |
| 2022 | 4,866 | 4,776 | 4,931 | 4,786 | 4,808 | 4,951 | 5,059 | 5,047 | 4,346 | 4,632 | 4,295 | 3,222 |
| 2023 | 3,203 | 3,336 | 4,461 | 4,080 | 4,183 | 5,087 | 5,178 | 4,713 | 5,336 | 5,528 | 4,791 | 4,761 |
| 2024 | 3,580 | |||||||||||
| - = No Data Reported; -- = Not Applicable; NA = Not Available; W = Withheld to avoid disclosure of individual company data. |
| Release Date: 3/29/2024 |
| Next Release Date: 4/30/2024 |