|
Download Data (XLS File) |
|
||||||||
|
||||||||
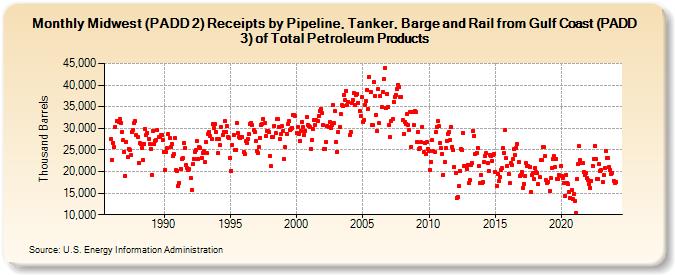
| Midwest (PADD 2) Receipts by Pipeline, Tanker, Barge and Rail from Gulf Coast (PADD 3) of Total Petroleum Products (Thousand Barrels) | ||||||||
| Year | Jan | Feb | Mar | Apr | May | Jun | Jul | Aug | Sep | Oct | Nov | Dec |
|---|---|---|---|---|---|---|---|---|---|---|---|---|
| 1986 | 27,423 | 22,757 | 26,689 | 25,608 | 30,330 | 31,726 | 31,686 | 31,532 | 32,101 | 31,310 | 29,243 | 27,285 |
| 1987 | 24,547 | 18,997 | 26,936 | 23,383 | 25,319 | 25,074 | 23,772 | 29,108 | 29,580 | 31,299 | 31,633 | 28,392 |
| 1988 | 28,038 | 22,062 | 26,511 | 26,441 | 25,489 | 22,679 | 26,451 | 29,906 | 28,502 | 29,023 | 27,563 | 26,347 |
| 1989 | 25,280 | 19,277 | 29,402 | 26,270 | 27,150 | 27,322 | 29,546 | 27,980 | 27,893 | 28,340 | 28,432 | 27,190 |
| 1990 | 24,593 | 20,428 | 24,474 | 25,365 | 28,618 | 27,772 | 25,562 | 26,330 | 23,644 | 24,097 | 27,732 | 20,316 |
| 1991 | 20,086 | 16,755 | 17,453 | 20,648 | 22,971 | 23,013 | 26,702 | 25,461 | 21,446 | 20,710 | 20,304 | 20,496 |
| 1992 | 18,462 | 15,794 | 21,719 | 22,986 | 24,601 | 24,989 | 27,053 | 22,942 | 25,695 | 25,513 | 23,204 | 24,298 |
| 1993 | 24,798 | 22,113 | 26,778 | 24,175 | 28,582 | 29,170 | 28,201 | 27,539 | 30,953 | 30,082 | 30,936 | 29,257 |
| 1994 | 27,460 | 24,225 | 27,463 | 26,062 | 30,329 | 28,463 | 29,217 | 31,602 | 29,243 | 30,501 | 27,931 | 27,668 |
| 1995 | 23,206 | 20,210 | 26,126 | 28,528 | 24,943 | 25,049 | 31,336 | 28,880 | 27,896 | 27,745 | 27,963 | 27,946 |
| 1996 | 24,440 | 24,039 | 27,002 | 26,599 | 27,633 | 28,640 | 31,050 | 31,312 | 30,679 | 29,566 | 29,258 | 26,951 |
| 1997 | 24,735 | 24,320 | 25,592 | 27,819 | 30,719 | 31,067 | 32,192 | 31,144 | 28,144 | 29,364 | 29,470 | 29,050 |
| 1998 | 23,625 | 21,249 | 27,979 | 28,088 | 30,638 | 28,850 | 32,088 | 32,040 | 30,373 | 27,487 | 28,615 | 30,525 |
| 1999 | 29,430 | 22,908 | 25,567 | 28,782 | 30,983 | 31,660 | 29,635 | 29,905 | 30,093 | 33,077 | 33,023 | 32,746 |
| 2000 | 28,967 | 30,190 | 28,614 | 27,061 | 29,435 | 31,489 | 30,286 | 28,427 | 29,431 | 32,669 | 30,807 | 30,638 |
| 2001 | 30,259 | 25,239 | 27,334 | 29,769 | 31,879 | 30,825 | 31,832 | 31,743 | 32,840 | 34,115 | 34,462 | 33,503 |
| 2002 | 30,865 | 25,185 | 25,264 | 26,828 | 30,595 | 30,238 | 31,490 | 30,161 | 30,717 | 35,323 | 31,160 | 33,935 |
| 2003 | 26,857 | 24,562 | 29,050 | 30,266 | 33,261 | 35,289 | 35,237 | 37,669 | 36,470 | 38,692 | 35,423 | 36,194 |
| 2004 | 28,351 | 29,149 | 35,749 | 36,576 | 38,175 | 35,333 | 37,772 | 38,052 | 35,898 | 33,987 | 32,759 | 37,200 |
| 2005 | 31,504 | 31,889 | 35,450 | 36,280 | 38,853 | 34,445 | 41,909 | 38,419 | 30,723 | 30,699 | 40,783 | 37,480 |
| 2006 | 33,088 | 29,311 | 39,032 | 31,179 | 37,396 | 35,004 | 38,369 | 41,338 | 43,976 | 34,596 | 38,026 | 35,044 |
| 2007 | 30,751 | 27,969 | 31,586 | 32,037 | 36,173 | 37,303 | 37,801 | 38,982 | 40,015 | 39,465 | 37,229 | 37,217 |
| 2008 | 31,819 | 28,726 | 31,440 | 31,007 | 33,229 | 30,855 | 29,717 | 33,850 | 25,737 | 33,733 | 30,716 | 33,936 |
| 2009 | 33,684 | 26,934 | 29,235 | 25,274 | 25,342 | 26,761 | 30,304 | 24,523 | 26,684 | 24,046 | 26,837 | 25,313 |
| 2010 | 24,818 | 20,332 | 22,219 | 27,183 | 24,742 | 24,441 | 29,043 | 30,309 | 31,576 | 30,462 | 26,701 | 25,418 |
| 2011 | 24,136 | 19,270 | 22,179 | 25,373 | 27,127 | 28,749 | 29,137 | 27,393 | 30,302 | 25,747 | 24,893 | 21,018 |
| 2012 | 19,705 | 13,911 | 14,050 | 16,530 | 20,140 | 25,229 | 24,940 | 28,917 | 21,291 | 21,359 | 20,565 | 21,533 |
| 2013 | 17,311 | 18,028 | 21,406 | 22,062 | 29,429 | 28,306 | 24,148 | 24,387 | 25,506 | 21,218 | 17,284 | 19,185 |
| 2014 | 17,322 | 17,515 | 22,263 | 23,595 | 24,168 | 21,984 | 20,197 | 23,854 | 23,540 | 22,534 | 23,885 | 24,111 |
| 2015 | 19,912 | 16,645 | 19,487 | 17,755 | 18,795 | 20,459 | 20,698 | 25,334 | 24,396 | 29,513 | 23,035 | 21,377 |
| 2016 | 19,371 | 17,258 | 21,912 | 21,490 | 22,823 | 25,126 | 23,852 | 25,538 | 26,407 | 22,214 | 18,914 | 19,106 |
| 2017 | 19,919 | 16,295 | 17,147 | 18,981 | 21,873 | 21,246 | 21,356 | 20,955 | 15,226 | 19,135 | 19,605 | 18,244 |
| 2018 | 20,801 | 19,908 | 19,667 | 17,002 | 18,768 | 22,563 | 22,728 | 25,624 | 25,572 | 23,478 | 18,012 | 17,409 |
| 2019 | 17,582 | 15,474 | 18,398 | 20,814 | 22,927 | 23,587 | 20,958 | 22,998 | 18,331 | 18,157 | 19,119 | 21,171 |
| 2020 | 18,852 | 18,561 | 17,291 | 14,397 | 19,271 | 17,413 | 16,997 | 15,206 | 13,964 | 15,692 | 13,690 | 14,704 |
| 2021 | 13,254 | 10,425 | 18,266 | 21,627 | 25,831 | 22,624 | 21,959 | 22,062 | 19,922 | 19,146 | 19,637 | 18,495 |
| 2022 | 18,009 | 17,153 | 16,231 | 17,865 | 21,325 | 22,950 | 25,959 | 22,995 | 18,232 | 18,203 | 21,704 | 20,091 |
| 2023 | 20,351 | 17,483 | 19,173 | 20,854 | 24,855 | 23,197 | 23,179 | 20,994 | 20,385 | 19,376 | 19,638 | 17,874 |
| 2024 | 17,342 | |||||||||||
| - = No Data Reported; -- = Not Applicable; NA = Not Available; W = Withheld to avoid disclosure of individual company data. |
| Release Date: 3/29/2024 |
| Next Release Date: 4/30/2024 |