|
Download Data (XLS File) |
|
||||||||
|
||||||||
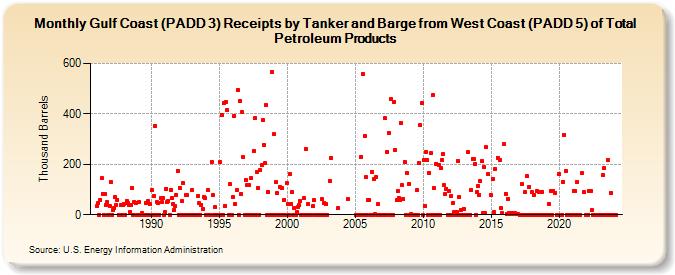
| Gulf Coast (PADD 3) Receipts by Tanker and Barge from West Coast (PADD 5) of Total Petroleum Products (Thousand Barrels) | ||||||||
| Year | Jan | Feb | Mar | Apr | May | Jun | Jul | Aug | Sep | Oct | Nov | Dec |
|---|---|---|---|---|---|---|---|---|---|---|---|---|
| 1986 | 35 | 45 | 0 | 59 | 144 | 84 | 0 | 82 | 40 | 50 | 0 | 35 |
| 1987 | 130 | 0 | 20 | 25 | 70 | 40 | 60 | 0 | 0 | 40 | 0 | 40 |
| 1988 | 43 | 0 | 56 | 45 | 40 | 10 | 39 | 105 | 0 | 50 | 46 | 0 |
| 1989 | 0 | 50 | 0 | 0 | 5 | 0 | 0 | 47 | 0 | 53 | 0 | 42 |
| 1990 | 98 | 0 | 75 | 351 | 0 | 50 | 48 | 0 | 65 | 49 | 66 | 0 |
| 1991 | 9 | 104 | 49 | 54 | 0 | 99 | 65 | 43 | 20 | 33 | 79 | 175 |
| 1992 | 0 | 107 | 0 | 54 | 125 | 0 | 78 | 77 | 0 | 0 | 0 | 0 |
| 1993 | 98 | 0 | 0 | 0 | 0 | 75 | 45 | 0 | 40 | 22 | 72 | 68 |
| 1994 | 0 | 0 | 97 | 0 | 0 | 208 | 78 | 0 | 30 | 0 | 0 | 0 |
| 1995 | 208 | 0 | 397 | 0 | 444 | 36 | 447 | 414 | 0 | 120 | 0 | 0 |
| 1996 | 71 | 393 | 43 | 97 | 496 | 0 | 451 | 82 | 406 | 227 | 0 | 136 |
| 1997 | 117 | 0 | 117 | 0 | 145 | 0 | 253 | 382 | 0 | 170 | 106 | 0 |
| 1998 | 177 | 196 | 376 | 278 | 204 | 436 | 0 | 91 | 0 | 0 | 566 | 0 |
| 1999 | 319 | 0 | 128 | 85 | 0 | 111 | 0 | 105 | 0 | 60 | 0 | 125 |
| 2000 | 42 | 0 | 161 | 43 | 90 | 0 | 28 | 0 | 10 | 30 | 38 | 55 |
| 2001 | 0 | 0 | 65 | 0 | 260 | 0 | 43 | 0 | 0 | 0 | 33 | 58 |
| 2002 | 0 | 0 | 0 | 0 | 0 | 0 | 61 | 0 | 48 | 0 | 43 | 0 |
| 2003 | 133 | 225 | 25 | |||||||||
| 2004 | 61 | |||||||||||
| 2005 | 0 | 0 | 0 | 0 | 0 | 230 | 559 | 0 | 314 | 148 | 0 | 57 |
| 2006 | 59 | 0 | 171 | 0 | 140 | 1 | 149 | 0 | 41 | 0 | 0 | |
| 2007 | 0 | 0 | 382 | 0 | 250 | 325 | 0 | 459 | 0 | 0 | 449 | 256 |
| 2008 | 57 | 95 | 65 | 60 | 365 | 117 | 62 | 210 | 0 | 165 | 123 | |
| 2009 | 0 | 3 | 0 | 0 | 0 | 0 | 97 | 0 | 205 | 355 | 443 | 0 |
| 2010 | 219 | 35 | 249 | 219 | 0 | 167 | 243 | 0 | 474 | 105 | 0 | 203 |
| 2011 | 0 | 199 | 0 | 187 | 217 | 239 | 116 | 83 | 104 | 0 | 94 | 0 |
| 2012 | 76 | 0 | 48 | 10 | 0 | 10 | 215 | 70 | 0 | 20 | 0 | 24 |
| 2013 | 0 | 0 | 247 | 0 | 0 | 99 | 222 | 222 | 203 | 0 | 89 | |
| 2014 | 112 | 80 | 132 | 213 | 5 | 190 | 5 | 267 | 160 | 79 | ||
| 2015 | 142 | 10 | 182 | 226 | 219 | 25 | 6 | 279 | ||||
| 2016 | 84 | 4 | 64 | 5 | 4 | 5 | 4 | 6 | 5 | 4 | 4 | 3 |
| 2017 | 0 | 0 | 121 | 0 | 90 | 0 | 152 | 0 | 111 | 0 | 90 | |
| 2018 | 0 | 80 | 0 | 0 | 95 | 0 | 92 | 0 | 92 | 0 | 0 | |
| 2019 | 0 | 0 | 42 | 0 | 95 | 0 | 96 | 88 | 0 | 0 | 161 | |
| 2020 | 0 | 0 | 0 | 129 | 318 | 175 | 0 | 0 | 0 | 0 | 0 | |
| 2021 | 96 | 96 | 0 | 130 | 0 | 0 | 0 | 164 | 90 | 0 | ||
| 2022 | 0 | 96 | 96 | 20 | 0 | 0 | 0 | 0 | 0 | 0 | 0 | |
| 2023 | 0 | 0 | 157 | 184 | 0 | 0 | 217 | 0 | 0 | 88 | 0 | 0 |
| 2024 | 0 | |||||||||||
| - = No Data Reported; -- = Not Applicable; NA = Not Available; W = Withheld to avoid disclosure of individual company data. |
| Release Date: 3/29/2024 |
| Next Release Date: 4/30/2024 |