|
Download Data (XLS File) |
|
||||||||
|
||||||||
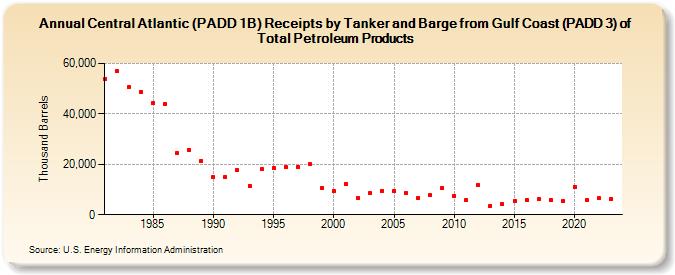
| Central Atlantic (PADD 1B) Receipts by Tanker and Barge from Gulf Coast (PADD 3) of Total Petroleum Products (Thousand Barrels) | ||||||||
| Decade | Year-0 | Year-1 | Year-2 | Year-3 | Year-4 | Year-5 | Year-6 | Year-7 | Year-8 | Year-9 |
|---|---|---|---|---|---|---|---|---|---|---|
| 1980's | 53,869 | 56,892 | 50,650 | 48,842 | 44,243 | 43,987 | 24,388 | 25,792 | 21,508 | |
| 1990's | 15,006 | 15,044 | 17,606 | 11,509 | 18,162 | 18,631 | 19,003 | 18,971 | 19,971 | 10,622 |
| 2000's | 9,486 | 12,353 | 6,674 | 8,444 | 9,545 | 9,512 | 8,693 | 6,638 | 7,759 | 10,738 |
| 2010's | 7,428 | 5,746 | 11,805 | 3,642 | 4,225 | 5,607 | 5,857 | 6,088 | 5,887 | 5,436 |
| 2020's | 11,176 | 5,789 | 6,465 | 6,404 |
| - = No Data Reported; -- = Not Applicable; NA = Not Available; W = Withheld to avoid disclosure of individual company data. |
| Release Date: 4/30/2024 |
| Next Release Date: 8/30/2024 |