|
Download Data (XLS File) |
|
||||||||
|
||||||||
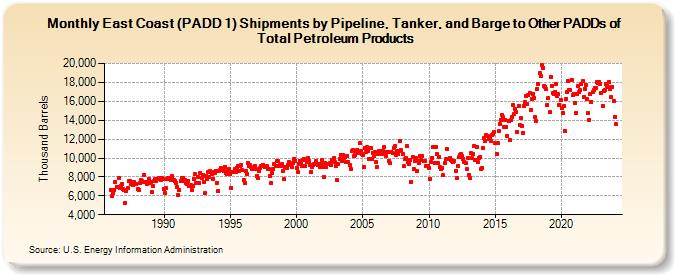
| East Coast (PADD 1) Shipments by Pipeline, Tanker, and Barge to Other PADDs of Total Petroleum Products (Thousand Barrels) | ||||||||
| Year | Jan | Feb | Mar | Apr | May | Jun | Jul | Aug | Sep | Oct | Nov | Dec |
|---|---|---|---|---|---|---|---|---|---|---|---|---|
| 1986 | 6,660 | 5,991 | 6,346 | 6,579 | 7,482 | 6,958 | 6,955 | 7,889 | 6,806 | 7,070 | 7,295 | 6,750 |
| 1987 | 6,634 | 5,289 | 6,558 | 6,838 | 7,529 | 7,560 | 7,275 | 7,424 | 7,126 | 7,503 | 7,242 | 7,214 |
| 1988 | 6,681 | 6,645 | 7,321 | 7,717 | 7,565 | 7,486 | 8,238 | 7,502 | 7,505 | 7,292 | 7,749 | 7,405 |
| 1989 | 7,495 | 6,362 | 7,036 | 7,527 | 7,749 | 7,589 | 7,827 | 7,876 | 7,728 | 7,679 | 7,889 | 7,790 |
| 1990 | 6,740 | 6,306 | 6,788 | 7,765 | 7,901 | 7,755 | 7,704 | 8,044 | 7,686 | 7,713 | 7,587 | 7,396 |
| 1991 | 6,944 | 6,089 | 6,585 | 7,558 | 7,909 | 7,937 | 7,553 | 7,697 | 7,367 | 7,276 | 7,600 | 7,055 |
| 1992 | 7,143 | 6,647 | 7,002 | 7,784 | 8,307 | 7,400 | 7,347 | 7,964 | 7,402 | 8,398 | 7,888 | 8,204 |
| 1993 | 7,501 | 6,253 | 8,072 | 7,798 | 8,516 | 8,033 | 8,599 | 8,281 | 7,830 | 8,506 | 8,437 | 8,666 |
| 1994 | 7,400 | 6,493 | 8,620 | 8,751 | 8,913 | 8,714 | 8,590 | 9,095 | 8,426 | 8,334 | 8,678 | 8,784 |
| 1995 | 8,257 | 6,832 | 8,505 | 8,506 | 8,785 | 8,470 | 8,974 | 9,138 | 8,664 | 9,148 | 9,226 | 8,733 |
| 1996 | 7,689 | 7,352 | 8,641 | 8,351 | 9,431 | 9,144 | 9,302 | 9,010 | 8,792 | 8,903 | 9,196 | 8,805 |
| 1997 | 8,142 | 7,922 | 8,627 | 8,943 | 9,194 | 9,105 | 9,276 | 9,071 | 9,033 | 9,111 | 8,794 | 8,848 |
| 1998 | 8,121 | 7,381 | 8,412 | 8,788 | 9,383 | 9,122 | 9,673 | 9,686 | 9,146 | 9,253 | 9,132 | 9,333 |
| 1999 | 8,658 | 7,763 | 9,031 | 8,904 | 9,311 | 9,556 | 9,355 | 9,367 | 9,041 | 9,505 | 9,918 | 9,688 |
| 2000 | 8,962 | 8,567 | 9,393 | 9,708 | 9,573 | 9,181 | 9,739 | 9,858 | 9,149 | 9,570 | 9,992 | 9,732 |
| 2001 | 9,310 | 8,569 | 9,003 | 9,261 | 9,416 | 9,386 | 9,696 | 9,231 | 9,324 | 9,029 | 9,393 | 9,743 |
| 2002 | 9,023 | 7,942 | 9,448 | 9,096 | 9,404 | 9,341 | 9,487 | 9,281 | 9,757 | 9,694 | 9,983 | 9,543 |
| 2003 | 9,118 | 7,649 | 9,321 | 9,905 | 10,349 | 9,709 | 10,336 | 10,042 | 10,138 | 9,595 | 10,222 | 9,561 |
| 2004 | 9,259 | 8,863 | 10,699 | 10,799 | 10,231 | 10,265 | 10,628 | 10,883 | 10,530 | 11,548 | 10,732 | 10,425 |
| 2005 | 10,364 | 9,047 | 11,090 | 10,677 | 11,131 | 10,792 | 9,932 | 11,110 | 9,875 | 10,547 | 10,164 | 10,677 |
| 2006 | 9,612 | 9,014 | 10,427 | 10,767 | 10,758 | 10,467 | 10,700 | 11,147 | 10,630 | 10,236 | 10,667 | 10,598 |
| 2007 | 9,696 | 9,421 | 10,673 | 10,557 | 11,014 | 11,224 | 10,327 | 10,764 | 10,472 | 10,781 | 11,826 | 10,833 |
| 2008 | 10,461 | 9,106 | 9,860 | 9,990 | 11,236 | 9,562 | 9,414 | 9,767 | 7,510 | 10,083 | 8,804 | 9,645 |
| 2009 | 9,953 | 8,583 | 9,723 | 9,420 | 10,215 | 9,740 | 10,226 | 9,675 | 9,655 | 9,188 | 9,178 | 9,167 |
| 2010 | 8,962 | 7,831 | 9,579 | 9,964 | 11,169 | 9,431 | 11,172 | 10,405 | 9,483 | 10,068 | 9,039 | 8,879 |
| 2011 | 8,964 | 8,153 | 9,482 | 9,922 | 10,996 | 9,942 | 9,868 | 10,041 | 9,771 | 9,731 | 9,580 | 9,716 |
| 2012 | 8,642 | 7,892 | 9,190 | 10,075 | 10,307 | 10,467 | 10,221 | 9,935 | 9,580 | 9,463 | 8,851 | 10,037 |
| 2013 | 8,180 | 7,883 | 10,509 | 9,964 | 10,467 | 11,273 | 9,823 | 11,186 | 9,581 | 9,991 | 10,065 | 8,846 |
| 2014 | 8,961 | 11,012 | 12,093 | 11,769 | 12,390 | 12,312 | 12,003 | 12,177 | 11,809 | 12,439 | 12,574 | 12,722 |
| 2015 | 11,561 | 10,465 | 11,570 | 12,826 | 13,617 | 14,048 | 14,595 | 14,329 | 13,317 | 14,042 | 13,286 | 12,351 |
| 2016 | 13,916 | 11,893 | 13,969 | 14,297 | 15,571 | 14,650 | 15,226 | 14,878 | 12,734 | 15,472 | 13,522 | 14,248 |
| 2017 | 13,387 | 12,672 | 15,481 | 15,880 | 16,528 | 15,698 | 16,688 | 16,923 | 15,122 | 16,290 | 16,791 | 16,393 |
| 2018 | 14,300 | 13,955 | 17,306 | 17,879 | 19,008 | 18,713 | 19,852 | 19,554 | 17,599 | 17,521 | 17,286 | 15,626 |
| 2019 | 16,317 | 14,821 | 18,573 | 17,660 | 16,825 | 16,742 | 16,988 | 17,799 | 16,531 | 16,742 | 15,640 | 16,176 |
| 2020 | 15,240 | 14,790 | 15,473 | 12,881 | 16,283 | 16,973 | 18,108 | 17,236 | 17,151 | 18,263 | 16,614 | 16,790 |
| 2021 | 15,837 | 14,729 | 16,741 | 17,644 | 16,951 | 17,144 | 17,829 | 18,104 | 16,416 | 17,331 | 17,729 | 16,252 |
| 2022 | 14,715 | 14,062 | 16,731 | 15,972 | 16,959 | 17,164 | 17,452 | 17,366 | 18,006 | 17,893 | 18,087 | 17,831 |
| 2023 | 16,918 | 15,529 | 17,121 | 17,209 | 17,789 | 17,648 | 17,563 | 18,046 | 17,344 | 16,448 | 17,523 | 16,010 |
| 2024 | 14,385 | |||||||||||
| - = No Data Reported; -- = Not Applicable; NA = Not Available; W = Withheld to avoid disclosure of individual company data. |
| Release Date: 3/29/2024 |
| Next Release Date: 4/30/2024 |