|
Download Data (XLS File) |
|
||||||||
|
||||||||
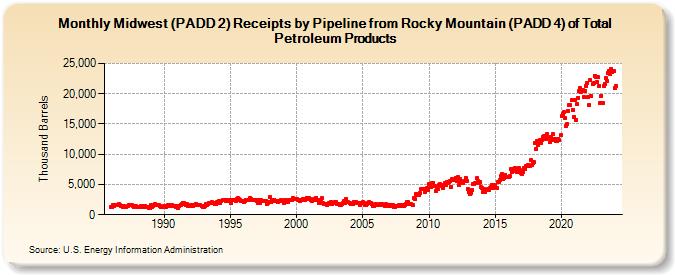
| Midwest (PADD 2) Receipts by Pipeline from Rocky Mountain (PADD 4) of Total Petroleum Products (Thousand Barrels) | ||||||||
| Year | Jan | Feb | Mar | Apr | May | Jun | Jul | Aug | Sep | Oct | Nov | Dec |
|---|---|---|---|---|---|---|---|---|---|---|---|---|
| 1986 | 1,334 | 1,258 | 1,573 | 1,491 | 1,628 | 1,525 | 1,646 | 1,765 | 1,600 | 1,514 | 1,418 | 1,231 |
| 1987 | 1,364 | 1,339 | 1,322 | 1,391 | 1,612 | 1,548 | 1,571 | 1,594 | 1,436 | 1,332 | 1,424 | 1,375 |
| 1988 | 1,314 | 1,283 | 1,299 | 1,378 | 1,458 | 1,330 | 1,431 | 1,453 | 1,347 | 1,289 | 1,113 | 1,130 |
| 1989 | 1,539 | 1,270 | 1,434 | 1,534 | 1,741 | 1,539 | 1,620 | 1,595 | 1,469 | 1,321 | 1,277 | 1,299 |
| 1990 | 1,391 | 1,279 | 1,318 | 1,425 | 1,638 | 1,441 | 1,543 | 1,646 | 1,468 | 1,405 | 1,461 | 1,313 |
| 1991 | 1,438 | 1,139 | 1,474 | 1,648 | 1,720 | 1,954 | 1,956 | 1,850 | 1,613 | 1,702 | 1,374 | 1,477 |
| 1992 | 1,605 | 1,435 | 1,501 | 1,658 | 1,622 | 1,765 | 1,591 | 1,576 | 1,558 | 1,571 | 1,408 | 1,354 |
| 1993 | 1,353 | 1,376 | 1,758 | 1,587 | 1,829 | 1,926 | 2,017 | 2,058 | 2,004 | 1,998 | 1,788 | 1,704 |
| 1994 | 2,035 | 1,944 | 2,242 | 1,930 | 2,280 | 2,432 | 2,462 | 2,417 | 2,345 | 2,369 | 2,321 | 2,394 |
| 1995 | 2,383 | 1,879 | 2,439 | 2,417 | 2,482 | 2,334 | 2,516 | 2,683 | 2,545 | 2,413 | 2,306 | 2,315 |
| 1996 | 2,132 | 2,207 | 2,444 | 2,383 | 2,359 | 2,437 | 2,775 | 2,571 | 2,460 | 2,418 | 2,398 | 2,377 |
| 1997 | 2,200 | 1,980 | 2,366 | 1,915 | 2,376 | 2,340 | 2,288 | 2,340 | 2,234 | 1,727 | 1,957 | 2,032 |
| 1998 | 2,927 | 2,048 | 2,409 | 2,279 | 2,484 | 2,310 | 2,327 | 2,174 | 2,189 | 2,272 | 2,405 | 2,226 |
| 1999 | 2,258 | 1,953 | 2,420 | 2,131 | 2,105 | 2,474 | 2,459 | 2,418 | 2,396 | 2,682 | 2,624 | 2,596 |
| 2000 | 2,574 | 2,487 | 2,453 | 2,279 | 2,500 | 2,450 | 2,530 | 2,605 | 2,483 | 2,788 | 2,672 | 2,699 |
| 2001 | 2,533 | 2,372 | 2,343 | 2,433 | 2,520 | 2,399 | 2,809 | 2,392 | 2,002 | 2,054 | 2,400 | 2,702 |
| 2002 | 1,855 | 1,818 | 1,805 | 1,830 | 1,553 | 1,930 | 1,815 | 2,074 | 1,763 | 1,988 | 1,936 | 2,102 |
| 2003 | 2,065 | 1,746 | 1,738 | 1,597 | 1,604 | 1,838 | 1,928 | 2,207 | 1,903 | 2,600 | 2,079 | 2,025 |
| 2004 | 1,961 | 1,727 | 1,850 | 1,835 | 2,147 | 2,057 | 2,070 | 1,917 | 1,939 | 1,650 | 1,864 | 1,981 |
| 2005 | 2,027 | 1,899 | 1,603 | 1,604 | 1,705 | 2,011 | 2,094 | 1,912 | 1,741 | 1,414 | 1,438 | 1,559 |
| 2006 | 1,789 | 1,632 | 1,677 | 1,630 | 1,689 | 1,787 | 1,609 | 1,590 | 1,506 | 1,691 | 1,679 | 1,658 |
| 2007 | 1,480 | 1,429 | 1,591 | 1,583 | 1,344 | 1,264 | 1,466 | 1,473 | 1,474 | 1,524 | 1,628 | 1,508 |
| 2008 | 1,605 | 1,454 | 1,660 | 1,754 | 2,076 | 2,097 | 1,821 | 1,747 | 1,734 | 1,592 | 2,718 | 2,550 |
| 2009 | 3,492 | 3,336 | 3,437 | 3,322 | 3,572 | 4,239 | 4,232 | 4,273 | 3,836 | 4,054 | 4,429 | 4,131 |
| 2010 | 5,008 | 5,093 | 4,560 | 5,191 | 5,290 | 4,686 | 3,985 | 4,613 | 4,323 | 4,924 | 5,063 | 4,994 |
| 2011 | 4,796 | 4,416 | 5,165 | 4,938 | 5,403 | 5,183 | 5,485 | 5,529 | 4,552 | 5,904 | 5,805 | 5,723 |
| 2012 | 6,117 | 5,592 | 6,174 | 4,974 | 5,905 | 5,461 | 5,444 | 5,262 | 5,515 | 6,113 | 5,549 | 4,279 |
| 2013 | 3,706 | 3,348 | 3,623 | 4,094 | 5,028 | 5,092 | 5,316 | 5,989 | 5,642 | 5,316 | 5,396 | 4,536 |
| 2014 | 4,424 | 3,750 | 4,244 | 3,833 | 4,028 | 4,200 | 4,086 | 4,357 | 4,555 | 4,990 | 4,394 | 4,836 |
| 2015 | 4,801 | 4,421 | 5,394 | 5,357 | 5,671 | 6,394 | 6,706 | 5,930 | 6,106 | 6,633 | 6,194 | 6,278 |
| 2016 | 6,263 | 6,355 | 7,503 | 6,982 | 7,188 | 7,597 | 7,727 | 7,336 | 7,066 | 7,663 | 7,331 | 6,827 |
| 2017 | 6,806 | 7,057 | 7,691 | 7,594 | 7,999 | 8,113 | 8,239 | 8,048 | 9,011 | 8,281 | 8,471 | 8,649 |
| 2018 | 11,932 | 10,901 | 12,116 | 11,564 | 12,275 | 11,851 | 12,392 | 12,902 | 12,933 | 12,670 | 12,547 | 13,338 |
| 2019 | 12,608 | 11,957 | 12,891 | 12,556 | 13,276 | 12,304 | 12,533 | 12,169 | 12,160 | 12,581 | 12,335 | 13,204 |
| 2020 | 16,299 | 16,661 | 16,914 | 15,995 | 14,649 | 14,995 | 17,213 | 18,213 | 18,081 | 18,915 | 17,381 | 16,158 |
| 2021 | 18,959 | 15,668 | 18,266 | 19,345 | 20,478 | 20,867 | 20,360 | 20,630 | 19,409 | 20,511 | 21,206 | 21,782 |
| 2022 | 19,485 | 18,128 | 22,255 | 19,556 | 21,535 | 21,723 | 23,003 | 22,708 | 21,995 | 22,719 | 21,291 | 18,541 |
| 2023 | 19,663 | 18,395 | 21,267 | 21,628 | 22,622 | 22,170 | 23,417 | 23,818 | 23,218 | 24,019 | 23,526 | 23,712 |
| 2024 | 20,922 | |||||||||||
| - = No Data Reported; -- = Not Applicable; NA = Not Available; W = Withheld to avoid disclosure of individual company data. |
| Release Date: 3/29/2024 |
| Next Release Date: 4/30/2024 |