|
Download Data (XLS File) |
|
||||||||
|
||||||||
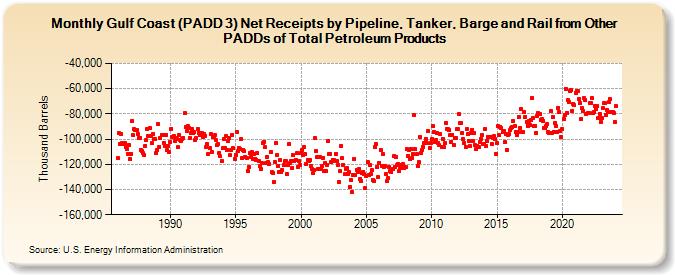
| Gulf Coast (PADD 3) Net Receipts by Pipeline, Tanker, Barge and Rail from Other PADDs of Total Petroleum Products (Thousand Barrels) | ||||||||
| Year | Jan | Feb | Mar | Apr | May | Jun | Jul | Aug | Sep | Oct | Nov | Dec |
|---|---|---|---|---|---|---|---|---|---|---|---|---|
| 1986 | -115,348 | -95,352 | -103,810 | -95,839 | -103,449 | -103,597 | -103,343 | -106,053 | -108,101 | -111,781 | -104,327 | -115,969 |
| 1987 | -111,461 | -85,604 | -96,987 | -92,242 | -93,029 | -92,839 | -95,788 | -98,963 | -98,742 | -108,695 | -109,329 | -111,366 |
| 1988 | -112,422 | -105,325 | -100,918 | -92,276 | -97,336 | -91,393 | -97,417 | -103,097 | -95,795 | -100,307 | -100,244 | -111,347 |
| 1989 | -108,312 | -88,399 | -105,991 | -98,806 | -96,436 | -96,428 | -102,776 | -105,436 | -96,678 | -108,912 | -105,116 | -110,360 |
| 1990 | -102,489 | -91,616 | -98,134 | -97,292 | -101,707 | -99,114 | -100,196 | -106,528 | -96,960 | -100,510 | -101,276 | -99,787 |
| 1991 | -99,105 | -79,614 | -90,516 | -93,669 | -89,496 | -91,428 | -99,152 | -95,167 | -92,112 | -95,492 | -94,289 | -100,495 |
| 1992 | -99,313 | -91,836 | -94,956 | -96,494 | -95,513 | -94,988 | -98,731 | -95,930 | -97,206 | -106,016 | -104,007 | -111,819 |
| 1993 | -107,370 | -96,029 | -110,236 | -98,677 | -97,406 | -96,992 | -100,390 | -105,050 | -104,112 | -111,004 | -113,656 | -117,335 |
| 1994 | -107,356 | -99,800 | -107,392 | -97,807 | -108,273 | -101,164 | -99,287 | -112,964 | -108,475 | -96,803 | -107,429 | -115,409 |
| 1995 | -112,348 | -94,174 | -109,579 | -106,994 | -107,854 | -100,307 | -115,379 | -108,436 | -109,800 | -114,024 | -115,117 | -124,942 |
| 1996 | -122,034 | -111,065 | -114,199 | -110,460 | -115,532 | -111,910 | -115,545 | -116,327 | -111,185 | -117,118 | -121,624 | -124,067 |
| 1997 | -119,086 | -103,067 | -101,935 | -106,577 | -119,091 | -113,908 | -118,208 | -119,617 | -110,272 | -126,428 | -126,658 | -133,973 |
| 1998 | -117,804 | -102,820 | -112,794 | -121,059 | -126,140 | -116,916 | -126,279 | -124,387 | -120,803 | -117,761 | -117,490 | -127,796 |
| 1999 | -120,927 | -103,726 | -119,077 | -117,377 | -122,691 | -112,924 | -117,360 | -116,618 | -111,274 | -122,106 | -117,368 | -120,844 |
| 2000 | -110,711 | -108,315 | -112,559 | -106,610 | -111,744 | -119,662 | -116,413 | -116,983 | -116,774 | -121,552 | -123,632 | -127,259 |
| 2001 | -124,704 | -99,455 | -109,819 | -114,484 | -123,670 | -114,394 | -124,093 | -121,534 | -114,772 | -125,667 | -119,310 | -125,567 |
| 2002 | -120,465 | -101,620 | -111,930 | -111,498 | -117,975 | -116,209 | -116,765 | -117,696 | -111,507 | -117,212 | -120,458 | -133,855 |
| 2003 | -125,530 | -105,339 | -115,063 | -120,200 | -128,030 | -123,468 | -123,261 | -127,686 | -126,395 | -137,801 | -132,831 | -142,025 |
| 2004 | -128,414 | -115,435 | -128,343 | -124,339 | -126,426 | -123,438 | -131,359 | -132,939 | -126,651 | -125,972 | -128,048 | -139,068 |
| 2005 | -129,496 | -118,222 | -128,876 | -120,402 | -127,663 | -124,772 | -132,636 | -133,523 | -106,543 | -103,993 | -122,063 | -130,209 |
| 2006 | -118,905 | -108,523 | -121,088 | -111,850 | -121,896 | -121,062 | -127,890 | -133,508 | -131,176 | -121,949 | -125,508 | -125,928 |
| 2007 | -123,705 | -113,800 | -121,804 | -114,189 | -120,872 | -119,951 | -125,233 | -123,122 | -120,776 | -122,683 | -120,041 | -123,200 |
| 2008 | -122,216 | -107,963 | -113,046 | -108,594 | -115,891 | -107,703 | -114,855 | -112,006 | -81,213 | -108,182 | -111,988 | -121,075 |
| 2009 | -118,443 | -98,212 | -110,842 | -108,411 | -105,905 | -103,123 | -103,211 | -100,008 | -103,475 | -93,701 | -107,182 | -103,112 |
| 2010 | -99,780 | -89,877 | -94,340 | -102,047 | -100,786 | -95,341 | -102,820 | -104,991 | -96,328 | -106,104 | -99,892 | -106,575 |
| 2011 | -103,312 | -86,861 | -91,805 | -92,272 | -92,475 | -96,877 | -102,091 | -96,443 | -104,305 | -98,973 | -99,074 | -92,380 |
| 2012 | -92,210 | -80,413 | -87,550 | -87,595 | -95,028 | -100,144 | -103,287 | -105,901 | -92,048 | -96,143 | -101,382 | -105,331 |
| 2013 | -95,361 | -92,751 | -101,495 | -95,145 | -104,514 | -108,204 | -105,527 | -106,015 | -102,626 | -99,557 | -96,648 | -103,554 |
| 2014 | -104,096 | -91,977 | -105,325 | -101,829 | -98,089 | -98,657 | -98,175 | -103,953 | -99,118 | -97,714 | -100,105 | -111,553 |
| 2015 | -103,151 | -89,470 | -96,922 | -90,107 | -91,284 | -94,008 | -93,268 | -102,561 | -96,207 | -108,358 | -96,429 | -96,193 |
| 2016 | -92,637 | -91,074 | -90,672 | -85,978 | -89,804 | -94,021 | -96,550 | -94,175 | -82,256 | -91,300 | -76,266 | -94,084 |
| 2017 | -94,621 | -78,590 | -82,317 | -86,266 | -89,403 | -85,246 | -88,432 | -84,872 | -67,389 | -83,167 | -89,492 | -89,235 |
| 2018 | -94,988 | -81,619 | -79,490 | -79,790 | -84,575 | -84,145 | -85,341 | -90,823 | -91,314 | -89,709 | -88,168 | -94,493 |
| 2019 | -95,218 | -77,795 | -94,812 | -82,238 | -94,114 | -87,481 | -89,880 | -94,148 | -74,993 | -78,488 | -93,862 | -98,163 |
| 2020 | -91,885 | -84,424 | -81,079 | -59,995 | -79,168 | -69,198 | -70,490 | -62,129 | -60,873 | -77,495 | -72,138 | -73,035 |
| 2021 | -63,143 | -61,586 | -61,729 | -68,402 | -71,305 | -84,096 | -75,697 | -77,837 | -67,717 | -69,254 | -79,727 | -79,274 |
| 2022 | -79,229 | -71,495 | -71,702 | -67,491 | -79,148 | -78,489 | -73,791 | -75,763 | -73,876 | -82,961 | -79,923 | -86,323 |
| 2023 | -82,996 | -75,718 | -71,636 | -71,364 | -80,503 | -76,706 | -78,814 | -70,196 | -68,387 | -78,186 | -78,828 | -79,378 |
| 2024 | -86,418 | |||||||||||
| - = No Data Reported; -- = Not Applicable; NA = Not Available; W = Withheld to avoid disclosure of individual company data. |
| Release Date: 3/29/2024 |
| Next Release Date: 4/30/2024 |