|
Download Data (XLS File) |
|
||||||||
|
||||||||
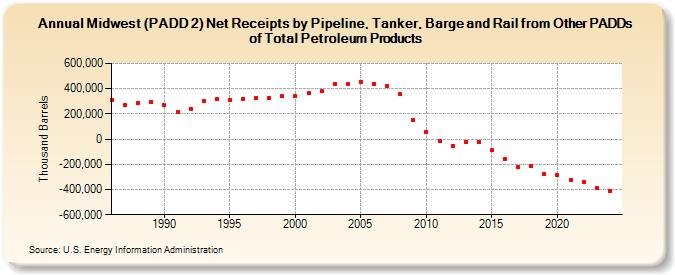
| Midwest (PADD 2) Net Receipts by Pipeline, Tanker, Barge and Rail from Other PADDs of Total Petroleum Products (Thousand Barrels) | ||||||||
| Decade | Year-0 | Year-1 | Year-2 | Year-3 | Year-4 | Year-5 | Year-6 | Year-7 | Year-8 | Year-9 |
|---|---|---|---|---|---|---|---|---|---|---|
| 1980's | 307,490 | 268,550 | 287,424 | 298,282 | ||||||
| 1990's | 267,326 | 217,688 | 239,294 | 303,851 | 315,186 | 309,682 | 321,480 | 326,311 | 327,645 | 344,311 |
| 2000's | 343,067 | 363,263 | 381,638 | 433,350 | 437,293 | 456,537 | 441,037 | 418,736 | 353,909 | 152,896 |
| 2010's | 54,765 | -12,047 | -52,389 | -19,840 | -21,451 | -90,033 | -155,135 | -218,307 | -213,117 | -279,440 |
| 2020's | -283,492 | -325,636 | -339,620 | -382,493 |
| - = No Data Reported; -- = Not Applicable; NA = Not Available; W = Withheld to avoid disclosure of individual company data. |
| Release Date: 3/29/2024 |
| Next Release Date: 8/30/2024 |