|
Download Data (XLS File) |
|
||||||||
|
||||||||
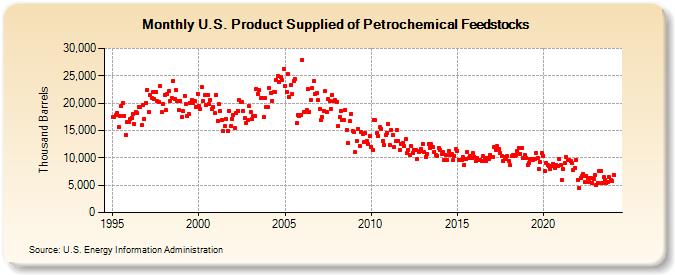
| U.S. Product Supplied of Petrochemical Feedstocks (Thousand Barrels) | ||||||||
| Year | Jan | Feb | Mar | Apr | May | Jun | Jul | Aug | Sep | Oct | Nov | Dec |
|---|---|---|---|---|---|---|---|---|---|---|---|---|
| 1995 | 17,413 | 17,533 | 17,811 | 18,172 | 15,592 | 17,715 | 19,456 | 19,987 | 17,736 | 14,162 | 16,520 | 16,484 |
| 1996 | 17,079 | 17,362 | 18,011 | 16,140 | 18,368 | 18,193 | 19,246 | 19,295 | 16,013 | 19,733 | 17,058 | 20,095 |
| 1997 | 22,454 | 18,455 | 21,475 | 21,014 | 21,958 | 20,739 | 22,103 | 20,325 | 20,283 | 23,105 | 18,307 | 19,841 |
| 1998 | 21,442 | 18,660 | 21,579 | 22,223 | 20,368 | 20,897 | 24,047 | 20,802 | 22,358 | 20,322 | 18,721 | 20,404 |
| 1999 | 17,402 | 18,476 | 21,377 | 19,872 | 17,623 | 18,022 | 20,074 | 20,619 | 20,084 | 20,402 | 19,246 | 21,725 |
| 2000 | 19,482 | 18,837 | 22,884 | 20,362 | 21,434 | 19,652 | 21,463 | 19,910 | 20,523 | 18,842 | 19,328 | 18,166 |
| 2001 | 21,483 | 16,796 | 19,786 | 18,480 | 16,919 | 14,879 | 15,831 | 17,127 | 14,959 | 18,607 | 15,786 | 17,150 |
| 2002 | 17,863 | 15,362 | 18,234 | 18,620 | 20,583 | 20,203 | 20,124 | 18,609 | 17,276 | 16,394 | 16,853 | 19,393 |
| 2003 | 18,380 | 17,058 | 17,588 | 17,725 | 22,651 | 21,693 | 22,328 | 20,884 | 20,857 | 17,527 | 20,878 | 19,294 |
| 2004 | 19,297 | 22,796 | 21,805 | 20,440 | 22,020 | 22,008 | 24,212 | 24,983 | 23,938 | 24,730 | 24,156 | 26,236 |
| 2005 | 23,129 | 22,065 | 25,305 | 21,148 | 23,354 | 21,649 | 24,062 | 24,370 | 16,313 | 17,788 | 17,597 | 17,892 |
| 2006 | 27,886 | 18,288 | 18,375 | 18,777 | 22,505 | 18,449 | 20,581 | 22,769 | 24,014 | 21,587 | 21,809 | 20,519 |
| 2007 | 18,898 | 16,837 | 17,443 | 18,616 | 22,173 | 18,342 | 20,788 | 20,437 | 19,003 | 21,490 | 20,378 | 20,511 |
| 2008 | 20,123 | 15,786 | 17,437 | 18,554 | 17,002 | 16,907 | 18,829 | 15,147 | 12,667 | 16,712 | 18,018 | 14,947 |
| 2009 | 14,798 | 11,034 | 13,114 | 15,359 | 12,235 | 14,811 | 14,397 | 12,915 | 14,544 | 13,064 | 12,485 | 14,081 |
| 2010 | 11,996 | 11,496 | 16,970 | 16,828 | 14,596 | 14,079 | 15,598 | 15,340 | 13,111 | 12,369 | 14,159 | 14,622 |
| 2011 | 16,152 | 12,279 | 15,116 | 14,155 | 11,903 | 13,030 | 15,126 | 13,088 | 11,424 | 12,532 | 12,667 | 12,086 |
| 2012 | 13,355 | 10,798 | 11,489 | 10,602 | 12,147 | 10,906 | 11,504 | 11,458 | 9,700 | 11,024 | 11,178 | 11,645 |
| 2013 | 12,574 | 11,019 | 10,165 | 10,749 | 12,531 | 11,857 | 12,479 | 11,894 | 11,082 | 10,557 | 10,401 | 11,806 |
| 2014 | 11,497 | 10,672 | 10,982 | 9,541 | 10,594 | 9,525 | 11,266 | 10,588 | 10,634 | 9,558 | 10,341 | 11,582 |
| 2015 | 11,244 | 9,582 | 9,560 | 9,559 | 10,080 | 8,781 | 9,763 | 11,141 | 9,895 | 10,410 | 10,042 | 10,829 |
| 2016 | 10,221 | 9,445 | 9,907 | 9,635 | 9,616 | 9,386 | 10,321 | 9,946 | 9,460 | 9,908 | 9,784 | 10,596 |
| 2017 | 10,065 | 10,168 | 12,049 | 11,420 | 12,072 | 11,677 | 10,917 | 10,334 | 9,337 | 10,125 | 9,767 | 10,320 |
| 2018 | 9,476 | 8,637 | 10,278 | 10,604 | 10,409 | 10,555 | 11,298 | 11,859 | 10,779 | 11,837 | 9,908 | 10,596 |
| 2019 | 9,992 | 8,755 | 9,075 | 9,796 | 9,716 | 9,673 | 9,767 | 10,949 | 10,009 | 7,925 | 9,172 | 10,947 |
| 2020 | 10,336 | 7,552 | 9,109 | 8,637 | 8,432 | 7,878 | 8,544 | 8,964 | 8,228 | 8,758 | 8,516 | 9,871 |
| 2021 | 8,657 | 6,031 | 7,959 | 9,006 | 10,156 | 9,541 | 9,580 | 9,419 | 9,000 | 7,722 | 8,124 | 9,650 |
| 2022 | 5,985 | 4,442 | 6,296 | 6,616 | 7,085 | 5,612 | 6,692 | 6,318 | 5,558 | 6,388 | 5,424 | 6,106 |
| 2023 | 6,942 | 4,960 | 5,450 | 7,668 | 7,606 | 5,340 | 6,445 | 5,885 | 5,343 | 5,632 | 6,418 | 6,029 |
| 2024 | 5,732 | |||||||||||
| - = No Data Reported; -- = Not Applicable; NA = Not Available; W = Withheld to avoid disclosure of individual company data. |
| Release Date: 3/29/2024 |
| Next Release Date: 4/30/2024 |