|
Download Data (XLS File) |
|
||||||||
|
||||||||
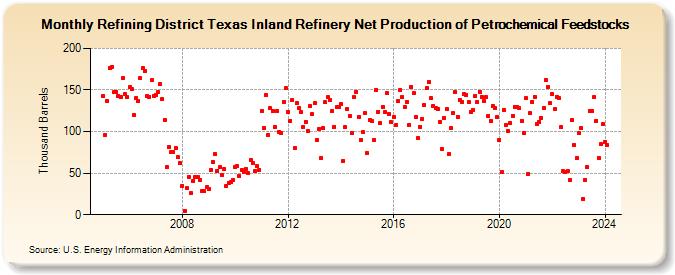
| Refining District Texas Inland Refinery Net Production of Petrochemical Feedstocks (Thousand Barrels) | ||||||||
| Year | Jan | Feb | Mar | Apr | May | Jun | Jul | Aug | Sep | Oct | Nov | Dec |
|---|---|---|---|---|---|---|---|---|---|---|---|---|
| 2005 | 143 | 96 | 137 | 176 | 178 | 147 | 148 | 143 | 141 | 164 | 145 | 141 |
| 2006 | 153 | 151 | 120 | 140 | 137 | 164 | 176 | 173 | 143 | 142 | 162 | 143 |
| 2007 | 144 | 147 | 157 | 139 | 114 | 57 | 82 | 75 | 75 | 80 | 69 | 62 |
| 2008 | 35 | 5 | 32 | 45 | 26 | 41 | 45 | 45 | 42 | 28 | 28 | 33 |
| 2009 | 31 | 54 | 63 | 73 | 53 | 57 | 48 | 55 | 34 | 38 | 39 | 42 |
| 2010 | 57 | 58 | 46 | 54 | 51 | 55 | 50 | 66 | 62 | 52 | 58 | 54 |
| 2011 | 125 | 104 | 144 | 96 | 128 | 125 | 106 | 125 | 100 | 98 | 136 | 152 |
| 2012 | 123 | 113 | 138 | 80 | 134 | 128 | 123 | 106 | 112 | 101 | 131 | 121 |
| 2013 | 134 | 90 | 103 | 68 | 104 | 135 | 141 | 138 | 125 | 106 | 129 | 129 |
| 2014 | 133 | 65 | 105 | 127 | 119 | 98 | 141 | 148 | 117 | 90 | 99 | 122 |
| 2015 | 74 | 114 | 113 | 90 | 150 | 124 | 110 | 130 | 123 | 146 | 121 | 111 |
| 2016 | 118 | 108 | 137 | 150 | 141 | 130 | 136 | 108 | 154 | 146 | 118 | 92 |
| 2017 | 106 | 115 | 132 | 152 | 160 | 140 | 131 | 128 | 127 | 112 | 79 | 116 |
| 2018 | 127 | 73 | 104 | 122 | 147 | 118 | 138 | 136 | 145 | 144 | 135 | 124 |
| 2019 | 126 | 143 | 136 | 148 | 142 | 137 | 141 | 119 | 113 | 131 | 128 | 118 |
| 2020 | 90 | 51 | 126 | 108 | 101 | 110 | 119 | 130 | 130 | 128 | 113 | 98 |
| 2021 | 140 | 49 | 122 | 136 | 142 | 109 | 112 | 116 | 128 | 162 | 154 | 134 |
| 2022 | 145 | 127 | 142 | 140 | 105 | 52 | 51 | 52 | 42 | 114 | 84 | 68 |
| 2023 | 98 | 104 | 19 | 42 | 57 | 125 | 125 | 141 | 113 | 68 | 85 | 109 |
| 2024 | 88 | |||||||||||
| - = No Data Reported; -- = Not Applicable; NA = Not Available; W = Withheld to avoid disclosure of individual company data. |
| Release Date: 3/29/2024 |
| Next Release Date: 4/30/2024 |