|
Download Data (XLS File) |
|
||||||||
|
||||||||
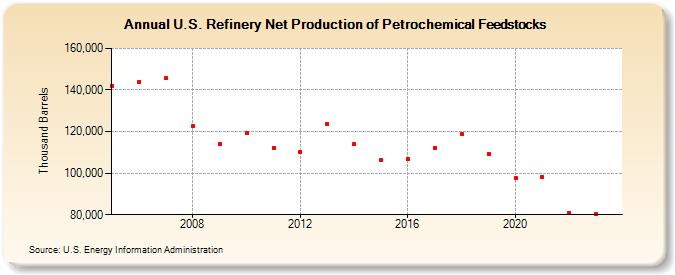
| U.S. Refinery Net Production of Petrochemical Feedstocks (Thousand Barrels) | ||||||||
| Decade | Year-0 | Year-1 | Year-2 | Year-3 | Year-4 | Year-5 | Year-6 | Year-7 | Year-8 | Year-9 |
|---|---|---|---|---|---|---|---|---|---|---|
| 2000's | 141,948 | 143,859 | 145,663 | 122,501 | 114,088 | |||||
| 2010's | 119,344 | 112,263 | 110,319 | 123,577 | 114,001 | 106,339 | 106,558 | 112,198 | 118,902 | 109,398 |
| 2020's | 97,769 | 98,363 | 80,875 | 80,154 |
| - = No Data Reported; -- = Not Applicable; NA = Not Available; W = Withheld to avoid disclosure of individual company data. |
| Release Date: 3/29/2024 |
| Next Release Date: 8/30/2024 |