|
Download Data (XLS File) |
|
||||||||
|
||||||||
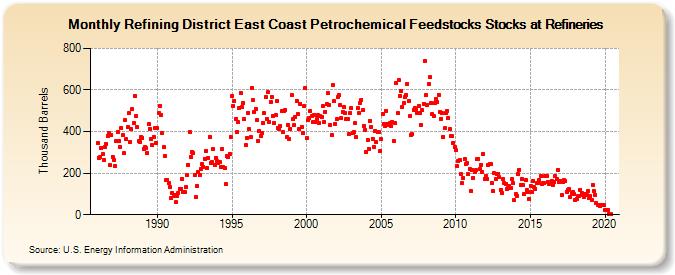
| Refining District East Coast Petrochemical Feedstocks Stocks at Refineries (Thousand Barrels) | ||||||||
| Year | Jan | Feb | Mar | Apr | May | Jun | Jul | Aug | Sep | Oct | Nov | Dec |
|---|---|---|---|---|---|---|---|---|---|---|---|---|
| 1986 | 344 | 274 | 279 | 321 | 291 | 263 | 327 | 342 | 378 | 391 | 238 | 384 |
| 1987 | 280 | 265 | 234 | 354 | 398 | 354 | 328 | 418 | 383 | 295 | 455 | 364 |
| 1988 | 421 | 488 | 350 | 410 | 507 | 442 | 572 | 474 | 420 | 354 | 350 | 376 |
| 1989 | 371 | 317 | 327 | 319 | 297 | 435 | 413 | 362 | 335 | 374 | 415 | 347 |
| 1990 | 417 | 489 | 525 | 482 | 394 | 325 | 281 | 166 | 166 | 154 | 135 | 79 |
| 1991 | 105 | 89 | 95 | 60 | 88 | 106 | 126 | 125 | 174 | 107 | 109 | 132 |
| 1992 | 189 | 241 | 398 | 280 | 304 | 295 | 189 | 83 | 138 | 206 | 191 | 221 |
| 1993 | 243 | 230 | 269 | 308 | 227 | 275 | 375 | 251 | 253 | 315 | 239 | 275 |
| 1994 | 258 | 249 | 255 | 230 | 317 | 229 | 225 | 147 | 282 | 279 | 292 | 375 |
| 1995 | 571 | 523 | 548 | 461 | 397 | 444 | 512 | 586 | 520 | 538 | 462 | 333 |
| 1996 | 371 | 491 | 410 | 374 | 610 | 550 | 492 | 509 | 454 | 355 | 402 | 381 |
| 1997 | 394 | 442 | 489 | 565 | 461 | 588 | 446 | 543 | 568 | 473 | 441 | 478 |
| 1998 | 549 | 419 | 412 | 426 | 499 | 396 | 501 | 504 | 373 | 433 | 365 | 414 |
| 1999 | 575 | 458 | 431 | 469 | 548 | 484 | 411 | 534 | 424 | 391 | 522 | 610 |
| 2000 | 367 | 454 | 463 | 499 | 473 | 446 | 480 | 444 | 460 | 478 | 440 | 473 |
| 2001 | 469 | 522 | 447 | 496 | 532 | 585 | 530 | 432 | 383 | 622 | 545 | 437 |
| 2002 | 459 | 567 | 574 | 527 | 466 | 496 | 519 | 491 | 458 | 461 | 387 | 491 |
| 2003 | 513 | 393 | 396 | 441 | 372 | 512 | 488 | 537 | 552 | 502 | 427 | 408 |
| 2004 | 303 | 360 | 318 | 452 | 424 | 366 | 327 | 402 | 349 | 397 | 396 | 305 |
| 2005 | 362 | 486 | 437 | 428 | 501 | 438 | 432 | 439 | 426 | 445 | 354 | 443 |
| 2006 | 634 | 487 | 647 | 572 | 596 | 517 | 536 | 564 | 576 | 631 | 548 | 477 |
| 2007 | 385 | 387 | 506 | 512 | 510 | 487 | 521 | 488 | 433 | 502 | 534 | 737 |
| 2008 | 576 | 530 | 630 | 660 | 539 | 483 | 474 | 535 | 556 | 541 | 578 | 495 |
| 2009 | 462 | 488 | 374 | 415 | 487 | 499 | 466 | 411 | 377 | 377 | 347 | 327 |
| 2010 | 310 | 232 | 259 | 264 | 196 | 151 | 177 | 266 | 246 | 247 | 194 | 219 |
| 2011 | 113 | 217 | 177 | 204 | 213 | 266 | 267 | 220 | 240 | 207 | 293 | 174 |
| 2012 | 185 | 173 | 237 | 242 | 242 | 154 | 113 | 199 | 172 | 196 | 198 | 179 |
| 2013 | 120 | 105 | 174 | 152 | 149 | 122 | 129 | 136 | 130 | 170 | 151 | 69 |
| 2014 | 98 | 92 | 195 | 217 | 142 | 172 | 144 | 102 | 165 | 118 | 111 | 74 |
| 2015 | 140 | 111 | 161 | 132 | 126 | 152 | 154 | 166 | 184 | 148 | 151 | 151 |
| 2016 | 185 | 184 | 159 | 146 | 154 | 164 | 143 | 155 | 184 | 171 | 217 | 159 |
| 2017 | 162 | 95 | 156 | 165 | 162 | 111 | 121 | 123 | 87 | 105 | 108 | 98 |
| 2018 | 71 | 77 | 89 | 91 | 121 | 105 | 94 | 87 | 102 | 97 | 114 | 80 |
| 2019 | 90 | 72 | 145 | 114 | 97 | 58 | 49 | 49 | 43 | 48 | 45 | 45 |
| 2020 | 22 | 22 | 24 | 4 | 2 | 2 | ||||||
| - = No Data Reported; -- = Not Applicable; NA = Not Available; W = Withheld to avoid disclosure of individual company data. |
| Release Date: 3/29/2024 |
| Next Release Date: 4/30/2024 |
Referring Pages: