|
Download Data (XLS File) |
|
||||||||
|
||||||||
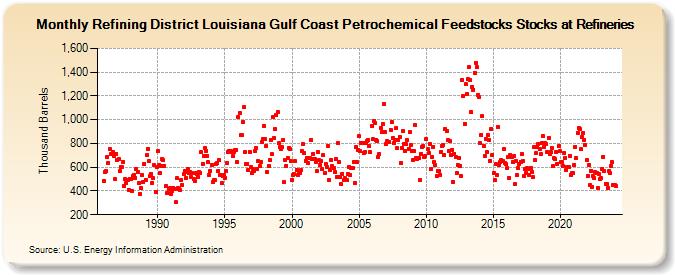
| Refining District Louisiana Gulf Coast Petrochemical Feedstocks Stocks at Refineries (Thousand Barrels) | ||||||||
| Year | Jan | Feb | Mar | Apr | May | Jun | Jul | Aug | Sep | Oct | Nov | Dec |
|---|---|---|---|---|---|---|---|---|---|---|---|---|
| 1986 | 481 | 558 | 569 | 686 | 636 | 752 | 707 | 713 | 725 | 696 | 498 | 715 |
| 1987 | 657 | 668 | 570 | 600 | 600 | 647 | 439 | 499 | 463 | 491 | 409 | 501 |
| 1988 | 499 | 399 | 524 | 538 | 512 | 583 | 562 | 470 | 376 | 423 | 535 | 473 |
| 1989 | 628 | 495 | 700 | 756 | 649 | 523 | 543 | 470 | 505 | 617 | 395 | 604 |
| 1990 | 733 | 617 | 547 | 606 | 666 | 657 | 613 | 441 | 379 | 382 | 415 | 423 |
| 1991 | 378 | 396 | 423 | 415 | 303 | 506 | 429 | 414 | 405 | 495 | 454 | 539 |
| 1992 | 571 | 510 | 563 | 586 | 555 | 562 | 517 | 551 | 497 | 482 | 548 | 545 |
| 1993 | 520 | 559 | 554 | 724 | 631 | 692 | 759 | 737 | 696 | 641 | 537 | 568 |
| 1994 | 619 | 476 | 490 | 492 | 628 | 639 | 568 | 664 | 537 | 464 | 523 | 538 |
| 1995 | 513 | 564 | 636 | 728 | 733 | 740 | 724 | 691 | 730 | 743 | 743 | 642 |
| 1996 | 1,022 | 1,058 | 870 | 867 | 980 | 1,105 | 726 | 627 | 628 | 573 | 731 | 598 |
| 1997 | 549 | 584 | 572 | 738 | 761 | 586 | 650 | 611 | 646 | 810 | 835 | 949 |
| 1998 | 835 | 782 | 561 | 612 | 659 | 831 | 707 | 1,020 | 845 | 922 | 1,042 | 1,066 |
| 1999 | 800 | 768 | 757 | 768 | 825 | 473 | 657 | 613 | 680 | 761 | 749 | 652 |
| 2000 | 494 | 535 | 542 | 650 | 580 | 536 | 565 | 548 | 576 | 736 | 794 | 717 |
| 2001 | 656 | 677 | 639 | 675 | 675 | 831 | 668 | 715 | 671 | 643 | 565 | 732 |
| 2002 | 658 | 622 | 649 | 582 | 702 | 555 | 627 | 602 | 781 | 493 | 575 | 662 |
| 2003 | 609 | 592 | 563 | 665 | 520 | 801 | 643 | 518 | 456 | 546 | 492 | 507 |
| 2004 | 494 | 489 | 545 | 604 | 534 | 597 | 590 | 644 | 470 | 767 | 641 | 747 |
| 2005 | 860 | 734 | 807 | 806 | 723 | 727 | 807 | 818 | 828 | 775 | 725 | 947 |
| 2006 | 836 | 989 | 973 | 831 | 817 | 687 | 711 | 928 | 894 | 965 | 1,130 | 893 |
| 2007 | 797 | 819 | 815 | 815 | 916 | 982 | 846 | 804 | 830 | 928 | 758 | 831 |
| 2008 | 855 | 635 | 765 | 908 | 796 | 740 | 795 | 825 | 756 | 895 | 785 | 733 |
| 2009 | 663 | 734 | 954 | 679 | 671 | 674 | 493 | 709 | 770 | 780 | 683 | 698 |
| 2010 | 838 | 753 | 719 | 794 | 588 | 685 | 774 | 640 | 618 | 526 | 567 | 569 |
| 2011 | 537 | 732 | 781 | 791 | 700 | 919 | 908 | 830 | 740 | 820 | 704 | 747 |
| 2012 | 477 | 715 | 688 | 551 | 619 | 679 | 609 | 524 | 1,335 | 1,198 | 967 | 1,297 |
| 2013 | 1,216 | 1,340 | 1,443 | 1,331 | 1,063 | 1,279 | 1,252 | 1,395 | 1,480 | 1,443 | 1,211 | 1,190 |
| 2014 | 800 | 874 | 1,027 | 781 | 696 | 839 | 724 | 867 | 832 | 654 | 922 | 704 |
| 2015 | 551 | 488 | 626 | 532 | 940 | 622 | 641 | 664 | 653 | 750 | 639 | 628 |
| 2016 | 596 | 690 | 512 | 699 | 682 | 645 | 694 | 458 | 649 | 534 | 591 | 631 |
| 2017 | 646 | 712 | 652 | 527 | 581 | 555 | 592 | 581 | 534 | 593 | 558 | 518 |
| 2018 | 771 | 658 | 717 | 768 | 797 | 753 | 710 | 804 | 862 | 774 | 803 | 795 |
| 2019 | 728 | 848 | 712 | 730 | 765 | 607 | 677 | 666 | 729 | 630 | 777 | 735 |
| 2020 | 643 | 642 | 612 | 720 | 680 | 577 | 601 | 599 | 698 | 533 | 550 | 554 |
| 2021 | 620 | 769 | 676 | 888 | 929 | 918 | 752 | 857 | 889 | 833 | 785 | 660 |
| 2022 | 528 | 621 | 447 | 572 | 437 | 525 | 507 | 556 | 552 | 421 | 542 | 504 |
| 2023 | 506 | 589 | 690 | 567 | 460 | 455 | 428 | 564 | 552 | 613 | 641 | 452 |
| 2024 | 450 | |||||||||||
| - = No Data Reported; -- = Not Applicable; NA = Not Available; W = Withheld to avoid disclosure of individual company data. |
| Release Date: 3/29/2024 |
| Next Release Date: 4/30/2024 |