|
Download Data (XLS File) |
|
||||||||
|
||||||||
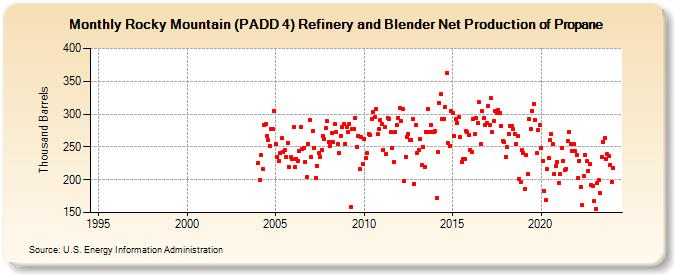
| Rocky Mountain (PADD 4) Refinery and Blender Net Production of Propane (Thousand Barrels) | ||||||||
| Year | Jan | Feb | Mar | Apr | May | Jun | Jul | Aug | Sep | Oct | Nov | Dec |
|---|---|---|---|---|---|---|---|---|---|---|---|---|
| 1995 | W | W | W | W | W | W | W | W | W | W | W | W |
| 1996 | W | W | W | W | W | W | W | W | W | W | W | W |
| 1997 | W | W | W | W | W | W | W | W | W | W | W | W |
| 1998 | W | W | W | W | W | W | W | W | W | W | W | W |
| 1999 | W | W | W | W | W | W | W | W | W | W | W | W |
| 2000 | W | W | W | W | W | W | W | W | W | W | W | W |
| 2001 | W | W | W | W | W | W | W | W | W | W | W | W |
| 2002 | W | W | W | W | W | W | W | W | W | W | W | W |
| 2003 | W | W | W | W | W | W | W | W | W | W | W | W |
| 2004 | 225 | 200 | 237 | 217 | 284 | 285 | 267 | 261 | 252 | 277 | 277 | 305 |
| 2005 | 254 | 235 | 229 | 240 | 263 | 242 | 246 | 235 | 256 | 219 | 234 | 232 |
| 2006 | 280 | 219 | 232 | 229 | 244 | 281 | 247 | 249 | 227 | 204 | 255 | 291 |
| 2007 | 234 | 274 | 249 | 203 | 221 | 240 | 235 | 246 | 266 | 262 | 279 | 289 |
| 2008 | 258 | 252 | 271 | 257 | 285 | 272 | 254 | 241 | 267 | 280 | 285 | 255 |
| 2009 | 281 | 273 | 285 | 159 | 278 | 278 | 294 | 250 | 267 | 217 | 265 | 224 |
| 2010 | 262 | 233 | 240 | 270 | 268 | 293 | 303 | 295 | 307 | 269 | 277 | 291 |
| 2011 | 285 | 246 | 280 | 239 | 294 | 293 | 272 | 248 | 227 | 272 | 283 | 294 |
| 2012 | 309 | 289 | 308 | 198 | 235 | 265 | 270 | 260 | 261 | 292 | 194 | 283 |
| 2013 | 241 | 245 | 262 | 223 | 250 | 220 | 273 | 308 | 273 | 284 | 272 | 272 |
| 2014 | 274 | 172 | 242 | 317 | 330 | 293 | 293 | 311 | 363 | 256 | 252 | 304 |
| 2015 | 301 | 267 | 292 | 286 | 296 | 265 | 227 | 231 | 231 | 274 | 272 | 268 |
| 2016 | 245 | 242 | 293 | 269 | 294 | 286 | 318 | 254 | 304 | 294 | 284 | 286 |
| 2017 | 313 | 284 | 324 | 273 | 290 | 304 | 301 | 306 | 302 | 282 | 259 | 257 |
| 2018 | 235 | 250 | 270 | 282 | 282 | 277 | 270 | 255 | 266 | 201 | 196 | 245 |
| 2019 | 241 | 186 | 237 | 208 | 292 | 278 | 305 | 316 | 291 | 240 | 276 | 283 |
| 2020 | 248 | 229 | 183 | 169 | 216 | 233 | 261 | 270 | 254 | 209 | 221 | 227 |
| 2021 | 195 | 209 | 248 | 228 | 215 | 217 | 259 | 272 | 255 | 244 | 254 | 243 |
| 2022 | 238 | 203 | 229 | 189 | 161 | 205 | 238 | 228 | 214 | 224 | 192 | 191 |
| 2023 | 167 | 156 | 195 | 199 | 180 | 235 | 258 | 264 | 232 | 239 | 236 | 223 |
| 2024 | 197 | |||||||||||
| - = No Data Reported; -- = Not Applicable; NA = Not Available; W = Withheld to avoid disclosure of individual company data. |
| Release Date: 3/29/2024 |
| Next Release Date: 4/30/2024 |