|
Download Data (XLS File) |
|
||||||||
|
||||||||
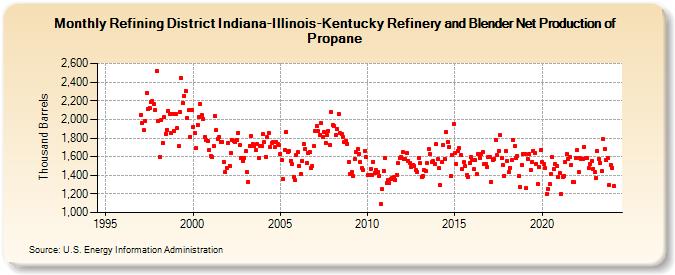
| Refining District Indiana-Illinois-Kentucky Refinery and Blender Net Production of Propane (Thousand Barrels) | ||||||||
| Year | Jan | Feb | Mar | Apr | May | Jun | Jul | Aug | Sep | Oct | Nov | Dec |
|---|---|---|---|---|---|---|---|---|---|---|---|---|
| 1995 | W | W | W | W | W | W | W | W | W | W | W | W |
| 1996 | W | W | W | W | W | W | W | W | W | W | W | W |
| 1997 | 2,052 | 1,961 | 1,884 | 1,978 | 2,287 | 2,111 | 2,127 | 2,184 | 2,193 | 2,168 | 2,103 | 2,517 |
| 1998 | 1,979 | 1,599 | 1,989 | 1,747 | 2,025 | 1,846 | 1,889 | 2,093 | 2,055 | 1,849 | 2,056 | 1,871 |
| 1999 | 2,061 | 1,903 | 1,710 | 2,084 | 2,444 | 2,173 | 2,253 | 2,306 | 2,019 | 2,098 | 1,816 | 2,100 |
| 2000 | 1,922 | 1,852 | 1,692 | 1,943 | 2,024 | 2,166 | 2,045 | 2,004 | 1,814 | 1,775 | 1,763 | 1,676 |
| 2001 | 1,604 | 1,597 | 1,711 | 2,035 | 1,882 | 1,792 | 1,809 | 1,756 | 1,759 | 1,548 | 1,431 | 1,480 |
| 2002 | 1,749 | 1,505 | 1,644 | 1,776 | 1,767 | 1,752 | 1,775 | 1,855 | 1,726 | 1,582 | 1,558 | 1,587 |
| 2003 | 1,656 | 1,433 | 1,328 | 1,716 | 1,820 | 1,733 | 1,714 | 1,670 | 1,731 | 1,588 | 1,718 | 1,717 |
| 2004 | 1,840 | 1,758 | 1,600 | 1,806 | 1,855 | 1,706 | 1,748 | 1,757 | 1,699 | 1,761 | 1,740 | 1,722 |
| 2005 | 1,633 | 1,559 | 1,357 | 1,675 | 1,867 | 1,651 | 1,662 | 1,558 | 1,517 | 1,387 | 1,345 | 1,615 |
| 2006 | 1,646 | 1,503 | 1,410 | 1,555 | 1,735 | 1,680 | 1,530 | 1,639 | 1,651 | 1,483 | 1,502 | 1,710 |
| 2007 | 1,877 | 1,927 | 1,871 | 1,830 | 1,961 | 1,811 | 1,864 | 1,748 | 1,836 | 1,879 | 1,727 | 2,077 |
| 2008 | 1,941 | 1,928 | 1,828 | 1,900 | 2,060 | 1,849 | 1,842 | 1,816 | 1,756 | 1,767 | 1,740 | 1,546 |
| 2009 | 1,412 | 1,431 | 1,393 | 1,574 | 1,646 | 1,679 | 1,629 | 1,540 | 1,475 | 1,455 | 1,666 | 1,593 |
| 2010 | 1,407 | 1,400 | 1,468 | 1,402 | 1,545 | 1,426 | 1,455 | 1,440 | 1,396 | 1,089 | 1,248 | 1,449 |
| 2011 | 1,582 | 1,322 | 1,345 | 1,312 | 1,358 | 1,374 | 1,378 | 1,353 | 1,405 | 1,528 | 1,585 | 1,601 |
| 2012 | 1,647 | 1,578 | 1,572 | 1,640 | 1,557 | 1,535 | 1,493 | 1,515 | 1,500 | 1,456 | 1,433 | 1,589 |
| 2013 | 1,527 | 1,385 | 1,393 | 1,452 | 1,443 | 1,529 | 1,679 | 1,628 | 1,541 | 1,554 | 1,525 | 1,731 |
| 2014 | 1,572 | 1,474 | 1,293 | 1,539 | 1,724 | 1,580 | 1,862 | 1,756 | 1,707 | 1,388 | 1,621 | 1,946 |
| 2015 | 1,640 | 1,520 | 1,665 | 1,690 | 1,613 | 1,467 | 1,539 | 1,497 | 1,400 | 1,382 | 1,536 | 1,596 |
| 2016 | 1,566 | 1,463 | 1,560 | 1,416 | 1,631 | 1,590 | 1,626 | 1,651 | 1,516 | 1,521 | 1,486 | 1,601 |
| 2017 | 1,601 | 1,333 | 1,559 | 1,578 | 1,784 | 1,613 | 1,665 | 1,829 | 1,585 | 1,513 | 1,396 | 1,660 |
| 2018 | 1,552 | 1,433 | 1,481 | 1,560 | 1,782 | 1,714 | 1,583 | 1,607 | 1,390 | 1,273 | 1,515 | 1,633 |
| 2019 | 1,629 | 1,263 | 1,576 | 1,626 | 1,459 | 1,543 | 1,664 | 1,639 | 1,523 | 1,309 | 1,494 | 1,674 |
| 2020 | 1,542 | 1,525 | 1,479 | 1,199 | 1,251 | 1,302 | 1,411 | 1,591 | 1,470 | 1,519 | 1,503 | 1,384 |
| 2021 | 1,423 | 1,198 | 1,385 | 1,396 | 1,540 | 1,624 | 1,572 | 1,592 | 1,515 | 1,329 | 1,324 | 1,590 |
| 2022 | 1,671 | 1,430 | 1,583 | 1,571 | 1,574 | 1,704 | 1,590 | 1,588 | 1,475 | 1,525 | 1,558 | 1,471 |
| 2023 | 1,435 | 1,373 | 1,659 | 1,575 | 1,534 | 1,445 | 1,786 | 1,681 | 1,559 | 1,588 | 1,299 | 1,513 |
| 2024 | 1,483 | |||||||||||
| - = No Data Reported; -- = Not Applicable; NA = Not Available; W = Withheld to avoid disclosure of individual company data. |
| Release Date: 3/29/2024 |
| Next Release Date: 4/30/2024 |