|
Download Data (XLS File) |
|
||||||||
|
||||||||
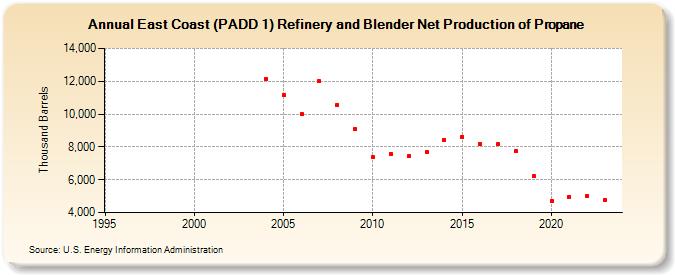
| East Coast (PADD 1) Refinery and Blender Net Production of Propane (Thousand Barrels) | ||||||||
| Decade | Year-0 | Year-1 | Year-2 | Year-3 | Year-4 | Year-5 | Year-6 | Year-7 | Year-8 | Year-9 |
|---|---|---|---|---|---|---|---|---|---|---|
| 1990's | W | W | W | W | W | |||||
| 2000's | W | W | W | W | 12,146 | 11,167 | 9,996 | 12,002 | 10,553 | 9,065 |
| 2010's | 7,373 | 7,582 | 7,424 | 7,693 | 8,427 | 8,623 | 8,166 | 8,170 | 7,721 | 6,210 |
| 2020's | 4,695 | 4,961 | 5,006 | 4,790 |
| - = No Data Reported; -- = Not Applicable; NA = Not Available; W = Withheld to avoid disclosure of individual company data. |
| Release Date: 3/29/2024 |
| Next Release Date: 8/30/2024 |