|
Download Data (XLS File) |
|
||||||||
|
||||||||
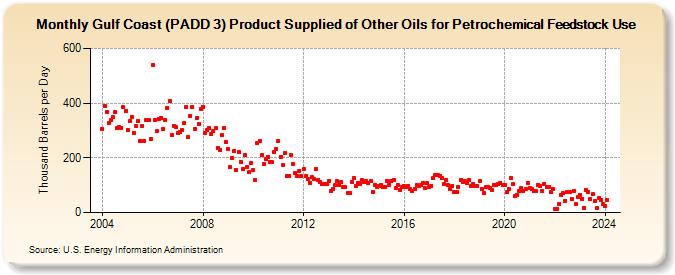
| Gulf Coast (PADD 3) Product Supplied of Other Oils for Petrochemical Feedstock Use (Thousand Barrels per Day) | ||||||||
| Year | Jan | Feb | Mar | Apr | May | Jun | Jul | Aug | Sep | Oct | Nov | Dec |
|---|---|---|---|---|---|---|---|---|---|---|---|---|
| 2004 | 305 | 390 | 369 | 327 | 338 | 350 | 367 | 308 | 312 | 310 | 384 | 371 |
| 2005 | 302 | 333 | 351 | 291 | 315 | 335 | 262 | 318 | 262 | 340 | 339 | 268 |
| 2006 | 541 | 339 | 298 | 343 | 346 | 307 | 339 | 383 | 406 | 285 | 318 | 311 |
| 2007 | 291 | 295 | 300 | 327 | 385 | 275 | 353 | 387 | 307 | 346 | 323 | 379 |
| 2008 | 387 | 289 | 302 | 308 | 286 | 299 | 308 | 237 | 229 | 283 | 309 | 257 |
| 2009 | 232 | 165 | 199 | 226 | 155 | 221 | 186 | 159 | 210 | 165 | 149 | 182 |
| 2010 | 155 | 119 | 253 | 262 | 210 | 177 | 194 | 203 | 184 | 183 | 222 | 232 |
| 2011 | 262 | 204 | 174 | 217 | 133 | 135 | 212 | 176 | 146 | 133 | 153 | 132 |
| 2012 | 158 | 132 | 121 | 109 | 129 | 121 | 161 | 120 | 110 | 103 | 106 | 103 |
| 2013 | 116 | 80 | 86 | 99 | 114 | 99 | 110 | 94 | 92 | 70 | 71 | 110 |
| 2014 | 125 | 98 | 109 | 105 | 118 | 111 | 116 | 109 | 114 | 76 | 102 | 93 |
| 2015 | 97 | 99 | 94 | 93 | 116 | 102 | 114 | 119 | 91 | 99 | 84 | 94 |
| 2016 | 98 | 95 | 98 | 86 | 78 | 87 | 101 | 97 | 99 | 107 | 91 | 107 |
| 2017 | 94 | 98 | 126 | 139 | 137 | 134 | 125 | 106 | 120 | 101 | 86 | 98 |
| 2018 | 76 | 74 | 94 | 119 | 110 | 115 | 109 | 119 | 96 | 103 | 96 | 96 |
| 2019 | 114 | 87 | 70 | 92 | 94 | 90 | 84 | 101 | 99 | 103 | 109 | 100 |
| 2020 | 102 | 74 | 87 | 126 | 104 | 61 | 63 | 77 | 90 | 80 | 85 | 109 |
| 2021 | 88 | 85 | 79 | 79 | 102 | 97 | 80 | 106 | 95 | 93 | 75 | 87 |
| 2022 | 13 | 14 | 32 | 65 | 70 | 43 | 76 | 75 | 50 | 80 | 30 | 57 |
| 2023 | 66 | 50 | 18 | 82 | 75 | 48 | 67 | 43 | 16 | 53 | 47 | 30 |
| 2024 | 23 | |||||||||||
| - = No Data Reported; -- = Not Applicable; NA = Not Available; W = Withheld to avoid disclosure of individual company data. |
| Release Date: 3/29/2024 |
| Next Release Date: 4/30/2024 |