|
Download Data (XLS File) |
|
||||||||
|
||||||||
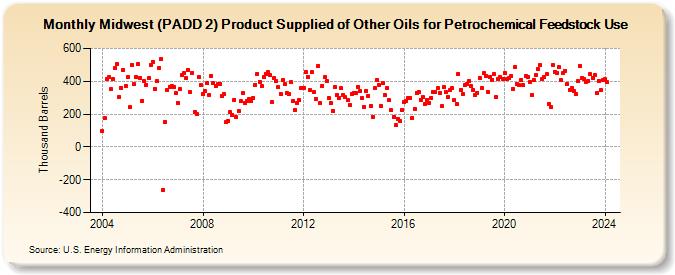
| Midwest (PADD 2) Product Supplied of Other Oils for Petrochemical Feedstock Use (Thousand Barrels) | ||||||||
| Year | Jan | Feb | Mar | Apr | May | Jun | Jul | Aug | Sep | Oct | Nov | Dec |
|---|---|---|---|---|---|---|---|---|---|---|---|---|
| 2004 | 97 | 173 | 414 | 424 | 351 | 411 | 483 | 503 | 304 | 359 | 470 | 371 |
| 2005 | 423 | 240 | 501 | 382 | 428 | 505 | 420 | 281 | 399 | 380 | 418 | 501 |
| 2006 | 520 | 353 | 400 | 482 | 534 | -262 | 152 | 349 | 367 | 370 | 366 | 326 |
| 2007 | 269 | 352 | 437 | 448 | 418 | 468 | 332 | 451 | 213 | 200 | 426 | 380 |
| 2008 | 325 | 338 | 389 | 317 | 432 | 387 | 371 | 383 | 386 | 313 | 320 | 149 |
| 2009 | 160 | 210 | 197 | 288 | 182 | 220 | 277 | 328 | 269 | 280 | 293 | 278 |
| 2010 | 297 | 380 | 447 | 398 | 368 | 424 | 446 | 454 | 435 | 271 | 417 | 401 |
| 2011 | 363 | 325 | 405 | 383 | 330 | 322 | 393 | 281 | 225 | 267 | 284 | 358 |
| 2012 | 360 | 455 | 428 | 345 | 454 | 333 | 293 | 494 | 265 | 373 | 425 | 400 |
| 2013 | 295 | 266 | 221 | 366 | 315 | 300 | 356 | 319 | 302 | 287 | 254 | 325 |
| 2014 | 330 | 328 | 367 | 338 | 297 | 245 | 341 | 312 | 252 | 184 | 356 | 408 |
| 2015 | 378 | 248 | 391 | 314 | 358 | 284 | 223 | 184 | 131 | 172 | 157 | 224 |
| 2016 | 272 | 279 | 300 | 299 | 178 | 233 | 330 | 336 | 288 | 301 | 260 | 288 |
| 2017 | 266 | 299 | 334 | 332 | 356 | 331 | 247 | 364 | 333 | 305 | 344 | 357 |
| 2018 | 285 | 260 | 447 | 346 | 320 | 376 | 382 | 399 | 368 | 348 | 317 | 331 |
| 2019 | 420 | 359 | 448 | 429 | 337 | 427 | 408 | 441 | 301 | 416 | 423 | 412 |
| 2020 | 452 | 413 | 419 | 431 | 355 | 487 | 382 | 375 | 408 | 375 | 430 | 425 |
| 2021 | 398 | 316 | 408 | 435 | 474 | 499 | 416 | 425 | 441 | 260 | 241 | 499 |
| 2022 | 457 | 451 | 484 | 405 | 448 | 465 | 382 | 347 | 359 | 341 | 323 | 401 |
| 2023 | 493 | 422 | 413 | 397 | 403 | 441 | 420 | 440 | 328 | 403 | 345 | 407 |
| 2024 | 411 | |||||||||||
| - = No Data Reported; -- = Not Applicable; NA = Not Available; W = Withheld to avoid disclosure of individual company data. |
| Release Date: 3/29/2024 |
| Next Release Date: 4/30/2024 |