|
Download Data (XLS File) |
|
||||||||
|
||||||||
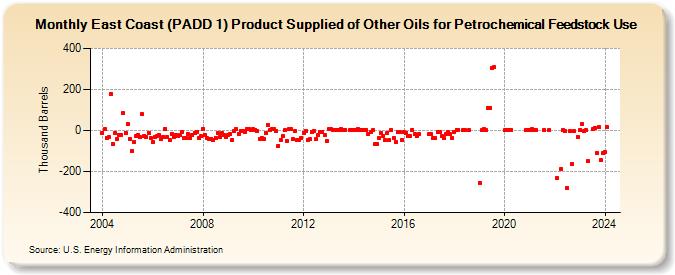
| East Coast (PADD 1) Product Supplied of Other Oils for Petrochemical Feedstock Use (Thousand Barrels) | ||||||||
| Year | Jan | Feb | Mar | Apr | May | Jun | Jul | Aug | Sep | Oct | Nov | Dec |
|---|---|---|---|---|---|---|---|---|---|---|---|---|
| 2004 | -11 | 6 | -36 | -34 | 180 | -66 | -11 | -40 | -23 | -24 | 83 | -12 |
| 2005 | 31 | -42 | -99 | -56 | -28 | -22 | -33 | 78 | -26 | -32 | -12 | -37 |
| 2006 | -55 | -31 | -29 | -20 | -42 | -30 | 9 | -33 | -48 | -17 | -33 | -22 |
| 2007 | -28 | -21 | -8 | -35 | -35 | -16 | -37 | -23 | -10 | -5 | -39 | -29 |
| 2008 | 9 | -23 | -39 | -42 | -42 | -45 | -36 | -14 | -30 | -10 | -24 | -34 |
| 2009 | -22 | -17 | -44 | -3 | 8 | -17 | -1 | -1 | -7 | 8 | 5 | 3 |
| 2010 | 7 | 4 | -3 | -41 | -36 | -41 | -11 | 25 | 3 | 5 | 5 | -3 |
| 2011 | -74 | -48 | -28 | 0 | -51 | 7 | 7 | -41 | -4 | -46 | -44 | -36 |
| 2012 | -10 | -1 | -48 | -43 | -7 | -2 | -42 | -24 | -6 | -6 | -23 | -52 |
| 2013 | 7 | 5 | 3 | 3 | 2 | 2 | 7 | 3 | 4 | 2 | 4 | |
| 2014 | 4 | 2 | 6 | 3 | 2 | 3 | 2 | -17 | -5 | 2 | -68 | -64 |
| 2015 | -36 | -10 | -27 | -48 | -10 | -46 | 2 | -36 | -54 | -9 | -9 | -46 |
| 2016 | -9 | -10 | -28 | -29 | 4 | -19 | -28 | -18 | ||||
| 2017 | -18 | -19 | -39 | -37 | -9 | -9 | -27 | -37 | -19 | -9 | -19 | -38 |
| 2018 | -6 | 3 | 4 | 1 | 3 | 1 | ||||||
| 2019 | -254 | 1 | 7 | 2 | 109 | 109 | 305 | 308 | ||||
| 2020 | 1 | 2 | 1 | 3 | 2 | 1 | ||||||
| 2021 | 3 | 5 | 1 | 1 | 1 | 1 | ||||||
| 2022 | -234 | -187 | 2 | -3 | -281 | -4 | -161 | -4 | -30 | |||
| 2023 | -82 | 41 | 14 | 12 | -139 | 10 | 11 | 13 | -94 | 16 | -86 | -96 |
| 2024 | -107 | 16 | 13 | 41 | 14 | 12 | ||||||
| - = No Data Reported; -- = Not Applicable; NA = Not Available; W = Withheld to avoid disclosure of individual company data. |
| Release Date: 8/30/2024 |
| Next Release Date: 9/30/2024 |