|
Download Data (XLS File) |
|
||||||||
|
||||||||
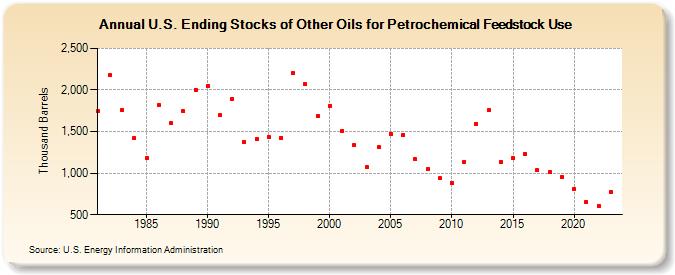
| U.S. Ending Stocks of Other Oils for Petrochemical Feedstock Use (Thousand Barrels) | ||||||||
| Decade | Year-0 | Year-1 | Year-2 | Year-3 | Year-4 | Year-5 | Year-6 | Year-7 | Year-8 | Year-9 |
|---|---|---|---|---|---|---|---|---|---|---|
| 1980's | 1,750 | 2,180 | 1,757 | 1,424 | 1,180 | 1,818 | 1,601 | 1,743 | 2,004 | |
| 1990's | 2,053 | 1,696 | 1,893 | 1,375 | 1,409 | 1,435 | 1,427 | 2,199 | 2,067 | 1,687 |
| 2000's | 1,812 | 1,512 | 1,333 | 1,068 | 1,313 | 1,476 | 1,460 | 1,165 | 1,052 | 937 |
| 2010's | 887 | 1,138 | 1,595 | 1,757 | 1,133 | 1,184 | 1,229 | 1,034 | 1,010 | 955 |
| 2020's | 812 | 658 | 605 | 774 |
| - = No Data Reported; -- = Not Applicable; NA = Not Available; W = Withheld to avoid disclosure of individual company data. |
| Release Date: 4/30/2024 |
| Next Release Date: 8/30/2024 |