|
Download Data (XLS File) |
|
||||||||
|
||||||||
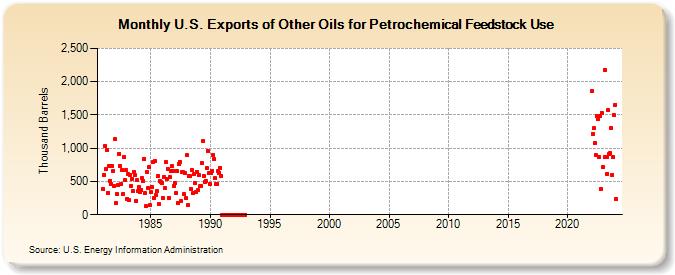
| U.S. Exports of Other Oils for Petrochemical Feedstock Use (Thousand Barrels) | ||||||||
| Year | Jan | Feb | Mar | Apr | May | Jun | Jul | Aug | Sep | Oct | Nov | Dec |
|---|---|---|---|---|---|---|---|---|---|---|---|---|
| 1981 | 384 | 598 | 1,031 | 680 | 973 | 333 | 733 | 510 | 468 | 729 | 658 | 430 |
| 1982 | 1,138 | 171 | 304 | 442 | 920 | 736 | 469 | 678 | 315 | 873 | 522 | 670 |
| 1983 | 237 | 616 | 215 | 599 | 437 | 541 | 357 | 645 | 591 | 207 | 516 | 356 |
| 1984 | 412 | 337 | 370 | 551 | 510 | 841 | 323 | 124 | 646 | 396 | 712 | 139 |
| 1985 | 341 | 420 | 792 | 251 | 811 | 289 | 351 | 584 | 161 | 501 | 495 | 482 |
| 1986 | 254 | 568 | 409 | 792 | 538 | 691 | 257 | 568 | 663 | 728 | 661 | 432 |
| 1987 | 473 | 319 | 661 | 175 | 769 | 793 | 199 | 638 | 646 | 305 | 627 | 248 |
| 1988 | 894 | 143 | 581 | 578 | 389 | 672 | 323 | 608 | 474 | 339 | 649 | 367 |
| 1989 | 599 | 427 | 427 | 779 | 1,103 | 581 | 488 | 512 | 707 | 961 | 620 | 458 |
| 1990 | 634 | 652 | 656 | 895 | 834 | 549 | 468 | 465 | 655 | 632 | 707 | 586 |
| 1991 | 0 | 0 | 0 | 0 | 0 | 0 | 0 | 0 | 0 | 0 | 0 | 0 |
| 1992 | 0 | 0 | 0 | 0 | 0 | 0 | 0 | 0 | 0 | 0 | 0 | 0 |
| 2022 | 1,853 | 1,214 | 1,297 | 1,076 | 898 | 1,480 | 1,436 | 873 | 1,491 | 386 | 1,530 | 710 |
| 2023 | 862 | 2,178 | 862 | 617 | 1,568 | 906 | 922 | 1,303 | 597 | 867 | 1,492 | |
| 2024 | 1,656 | |||||||||||
| - = No Data Reported; -- = Not Applicable; NA = Not Available; W = Withheld to avoid disclosure of individual company data. |
| Release Date: 3/29/2024 |
| Next Release Date: 4/30/2024 |