|
Download Data (XLS File) |
|
||||||||
|
||||||||
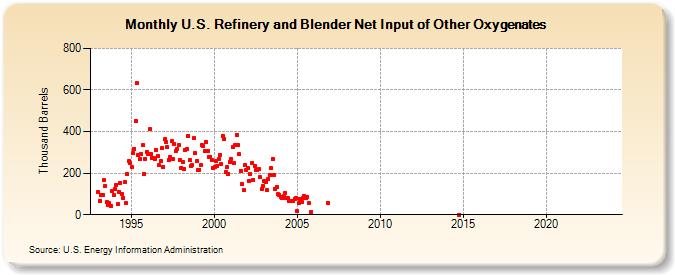
| U.S. Refinery and Blender Net Input of Other Oxygenates (Thousand Barrels) | ||||||||
| Year | Jan | Feb | Mar | Apr | May | Jun | Jul | Aug | Sep | Oct | Nov | Dec |
|---|---|---|---|---|---|---|---|---|---|---|---|---|
| 1993 | 108 | 68 | 93 | 94 | 165 | 139 | 62 | 48 | 55 | 44 | 113 | 95 |
| 1994 | 122 | 143 | 51 | 110 | 154 | 98 | 82 | 157 | 56 | 197 | 258 | 248 |
| 1995 | 229 | 295 | 318 | 452 | 633 | 288 | 267 | 291 | 334 | 197 | 269 | 303 |
| 1996 | 290 | 410 | 290 | 274 | 275 | 269 | 312 | 281 | 237 | 257 | 319 | 230 |
| 1997 | 362 | 349 | 324 | 261 | 277 | 353 | 267 | 339 | 306 | 314 | 333 | 265 |
| 1998 | 227 | 254 | 219 | 313 | 314 | 379 | 263 | 236 | 237 | 367 | 295 | 259 |
| 1999 | 215 | 217 | 237 | 333 | 330 | 305 | 349 | 305 | 278 | 280 | 262 | 223 |
| 2000 | 230 | 258 | 236 | 267 | 288 | 244 | 378 | 366 | 204 | 229 | 198 | 253 |
| 2001 | 268 | 325 | 248 | 334 | 383 | 335 | 290 | 212 | 148 | 117 | 238 | 215 |
| 2002 | 225 | 161 | 195 | 250 | 168 | 236 | 216 | 215 | 219 | 179 | 123 | 138 |
| 2003 | 164 | 159 | 118 | 170 | 190 | 223 | 269 | 190 | 126 | 133 | 98 | 97 |
| 2004 | 86 | 80 | 89 | 105 | 79 | 78 | 68 | 64 | 68 | 66 | 77 | 80 |
| 2005 | 16 | 58 | 77 | 59 | 80 | 90 | 79 | 85 | 54 | 14 | ||
| 2006 | 57 | |||||||||||
| 2014 | 1 | |||||||||||
| 2019 | -- | -- | -- | -- | -- | -- | -- | -- | -- | -- | -- | -- |
| 2020 | -- | -- | -- | -- | -- | -- | -- | -- | -- | -- | -- | -- |
| 2021 | -- | -- | -- | -- | -- | -- | -- | -- | -- | -- | -- | |
| 2022 | -- | -- | -- | -- | -- | -- | -- | -- | -- | -- | -- | -- |
| 2023 | -- | -- | -- | -- | -- | -- | -- | -- | -- | -- | -- | -- |
| 2024 | -- | |||||||||||
| - = No Data Reported; -- = Not Applicable; NA = Not Available; W = Withheld to avoid disclosure of individual company data. |
| Release Date: 3/29/2024 |
| Next Release Date: 4/30/2024 |