|
Download Data (XLS File) |
|
||||||||
|
||||||||
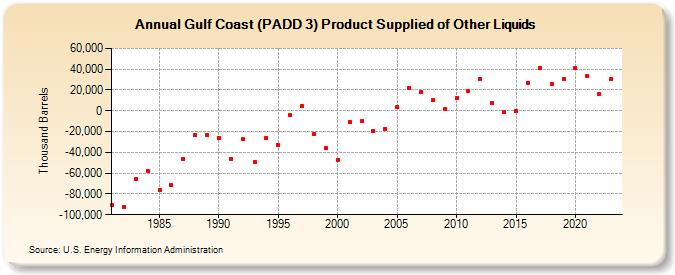
| Gulf Coast (PADD 3) Product Supplied of Other Liquids (Thousand Barrels) | ||||||||
| Decade | Year-0 | Year-1 | Year-2 | Year-3 | Year-4 | Year-5 | Year-6 | Year-7 | Year-8 | Year-9 |
|---|---|---|---|---|---|---|---|---|---|---|
| 1980's | -90,848 | -92,297 | -65,692 | -57,656 | -76,464 | -71,257 | -46,197 | -23,770 | -23,663 | |
| 1990's | -25,935 | -46,215 | -27,324 | -49,282 | -26,341 | -32,954 | -4,478 | 4,711 | -22,803 | -36,185 |
| 2000's | -47,013 | -10,934 | -9,917 | -19,276 | -17,168 | 3,831 | 22,117 | 18,170 | 10,265 | 1,355 |
| 2010's | 12,159 | 18,986 | 30,822 | 7,803 | -1,535 | -333 | 26,708 | 40,994 | 25,916 | 30,092 |
| 2020's | 41,319 | 33,352 | 16,253 | 30,476 |
| - = No Data Reported; -- = Not Applicable; NA = Not Available; W = Withheld to avoid disclosure of individual company data. |
| Release Date: 4/30/2024 |
| Next Release Date: 8/30/2024 |