|
Download Data (XLS File) |
|
||||||||
|
||||||||
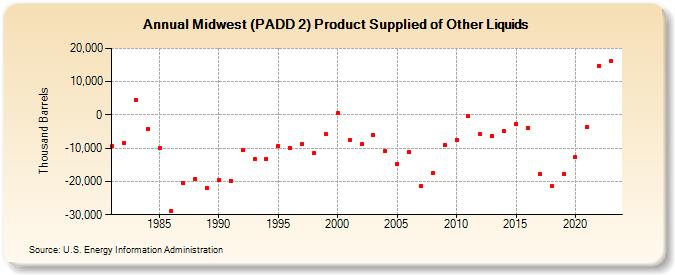
| Midwest (PADD 2) Product Supplied of Other Liquids (Thousand Barrels) | ||||||||
| Decade | Year-0 | Year-1 | Year-2 | Year-3 | Year-4 | Year-5 | Year-6 | Year-7 | Year-8 | Year-9 |
|---|---|---|---|---|---|---|---|---|---|---|
| 1980's | -9,460 | -8,510 | 4,496 | -4,136 | -9,920 | -28,837 | -20,581 | -19,150 | -21,977 | |
| 1990's | -19,668 | -19,742 | -10,605 | -13,343 | -13,119 | -9,400 | -9,831 | -8,623 | -11,564 | -5,837 |
| 2000's | 494 | -7,414 | -8,886 | -5,903 | -10,888 | -14,796 | -11,242 | -21,441 | -17,551 | -9,107 |
| 2010's | -7,496 | -467 | -5,795 | -6,306 | -4,927 | -2,845 | -3,812 | -17,789 | -21,286 | -17,640 |
| 2020's | -12,712 | -3,759 | 14,802 | 16,057 |
| - = No Data Reported; -- = Not Applicable; NA = Not Available; W = Withheld to avoid disclosure of individual company data. |
| Release Date: 8/30/2024 |
| Next Release Date: 8/29/2025 |