|
Download Data (XLS File) |
|
||||||||
|
||||||||
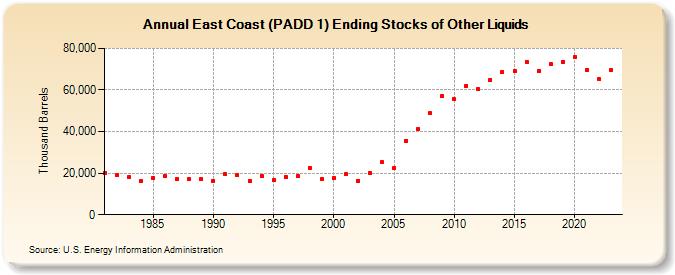
| East Coast (PADD 1) Ending Stocks of Other Liquids (Thousand Barrels) | ||||||||
| Decade | Year-0 | Year-1 | Year-2 | Year-3 | Year-4 | Year-5 | Year-6 | Year-7 | Year-8 | Year-9 |
|---|---|---|---|---|---|---|---|---|---|---|
| 1980's | 20,211 | 19,051 | 18,070 | 16,104 | 17,873 | 18,477 | 17,248 | 17,290 | 16,959 | |
| 1990's | 16,402 | 19,426 | 18,908 | 16,114 | 18,750 | 16,777 | 18,304 | 18,817 | 22,620 | 17,269 |
| 2000's | 17,677 | 19,354 | 16,393 | 19,964 | 25,193 | 22,623 | 35,584 | 41,170 | 48,782 | 57,188 |
| 2010's | 55,476 | 62,129 | 60,337 | 64,970 | 68,706 | 69,219 | 73,650 | 69,159 | 72,313 | 73,691 |
| 2020's | 75,892 | 69,560 | 65,100 | 69,408 |
| - = No Data Reported; -- = Not Applicable; NA = Not Available; W = Withheld to avoid disclosure of individual company data. |
| Release Date: 3/29/2024 |
| Next Release Date: 8/30/2024 |