|
Download Data (XLS File) |
|
||||||||
|
||||||||
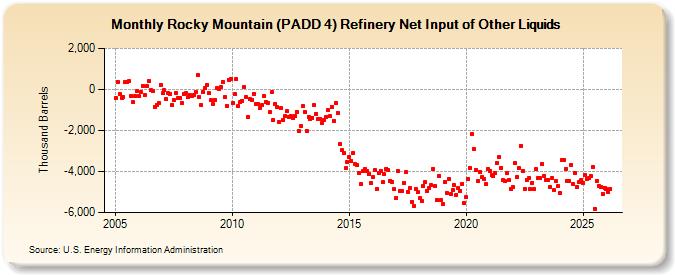
| Rocky Mountain (PADD 4) Refinery Net Input of Other Liquids (Thousand Barrels) | ||||||||
| Year | Jan | Feb | Mar | Apr | May | Jun | Jul | Aug | Sep | Oct | Nov | Dec |
|---|---|---|---|---|---|---|---|---|---|---|---|---|
| 2005 | -401 | 351 | -246 | -410 | -380 | 370 | 374 | 392 | -328 | -625 | -319 | -57 |
| 2006 | -344 | -124 | 191 | -284 | 166 | 414 | -43 | -99 | -837 | -737 | -651 | 217 |
| 2007 | -191 | -42 | -472 | -194 | -205 | -743 | -525 | -162 | -423 | -408 | -651 | -244 |
| 2008 | -196 | -389 | -261 | -328 | -273 | -120 | 697 | -378 | -773 | -132 | 87 | 234 |
| 2009 | -194 | -534 | -720 | -507 | 49 | 25 | 128 | 380 | -381 | -800 | 476 | 499 |
| 2010 | -663 | -246 | 503 | -803 | -597 | -548 | 95 | -380 | -1,321 | -465 | -507 | -200 |
| 2011 | -723 | -704 | -888 | -773 | -333 | -593 | -647 | -1,100 | -139 | -1,496 | -692 | -866 |
| 2012 | -1,584 | -925 | -1,482 | -1,298 | -1,073 | -1,321 | -1,313 | -1,412 | -1,293 | -1,076 | -2,006 | -1,797 |
| 2013 | -809 | -1,083 | -2,020 | -1,348 | -1,453 | -1,389 | -782 | -1,177 | -1,428 | -1,449 | -1,646 | -1,500 |
| 2014 | -1,329 | -1,006 | -1,298 | -836 | -1,517 | -679 | -1,130 | -2,667 | -2,969 | -3,093 | -3,849 | -3,527 |
| 2015 | -3,316 | -3,479 | -3,087 | -3,630 | -3,701 | -4,079 | -4,615 | -3,990 | -3,882 | -3,964 | -4,126 | -4,573 |
| 2016 | -4,286 | -3,929 | -4,848 | -4,078 | -3,952 | -4,528 | -4,136 | -3,853 | -3,933 | -4,448 | -4,488 | -4,872 |
| 2017 | -5,273 | -3,990 | -4,936 | -4,965 | -4,547 | -4,043 | -4,989 | -4,781 | -5,473 | -5,662 | -4,846 | -5,022 |
| 2018 | -5,313 | -5,413 | -4,690 | -4,529 | -4,931 | -4,806 | -4,667 | -3,856 | -4,710 | -5,391 | -4,208 | -5,387 |
| 2019 | -5,589 | -4,509 | -5,027 | -4,357 | -5,105 | -4,907 | -4,679 | -5,140 | -4,807 | -4,927 | -4,593 | -5,539 |
| 2020 | -5,264 | -4,366 | -3,820 | -2,160 | -2,905 | -3,919 | -4,466 | -4,009 | -4,272 | -4,345 | -4,610 | -3,875 |
| 2021 | -3,971 | -4,194 | -4,236 | -4,093 | -3,577 | -3,300 | -3,807 | -4,430 | -4,481 | -4,073 | -4,414 | -4,870 |
| 2022 | -4,777 | -3,590 | -4,245 | -3,852 | -2,739 | -3,964 | -4,852 | -4,412 | -4,331 | -4,856 | -4,541 | -4,871 |
| 2023 | -3,885 | -4,461 | -4,330 | -3,617 | -4,200 | -4,142 | -4,440 | -4,745 | -4,339 | -4,923 | -4,476 | -4,716 |
| 2024 | -5,049 | |||||||||||
| - = No Data Reported; -- = Not Applicable; NA = Not Available; W = Withheld to avoid disclosure of individual company data. |
| Release Date: 3/29/2024 |
| Next Release Date: 4/30/2024 |
Referring Pages: