|
Download Data (XLS File) |
|
||||||||
|
||||||||
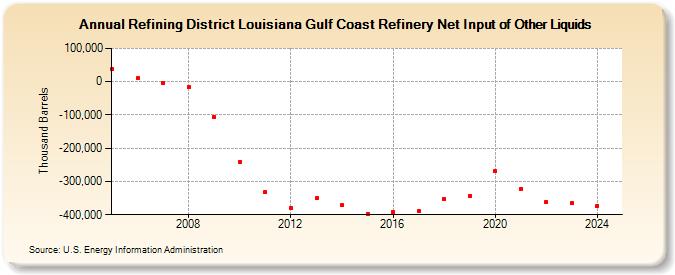
| Refining District Louisiana Gulf Coast Refinery Net Input of Other Liquids (Thousand Barrels) | ||||||||
| Decade | Year-0 | Year-1 | Year-2 | Year-3 | Year-4 | Year-5 | Year-6 | Year-7 | Year-8 | Year-9 |
|---|---|---|---|---|---|---|---|---|---|---|
| 2000's | 36,803 | 9,596 | -2,935 | -14,907 | -106,883 | |||||
| 2010's | -240,423 | -332,463 | -379,348 | -351,006 | -372,186 | -397,822 | -392,481 | -389,434 | -352,016 | -342,712 |
| 2020's | -269,897 | -322,321 | -361,529 | -365,315 |
| - = No Data Reported; -- = Not Applicable; NA = Not Available; W = Withheld to avoid disclosure of individual company data. |
| Release Date: 3/29/2024 |
| Next Release Date: 8/30/2024 |