|
Download Data (XLS File) |
|
||||||||
|
||||||||
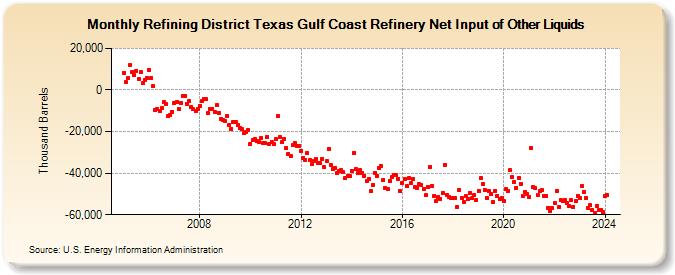
| Refining District Texas Gulf Coast Refinery Net Input of Other Liquids (Thousand Barrels) | ||||||||
| Year | Jan | Feb | Mar | Apr | May | Jun | Jul | Aug | Sep | Oct | Nov | Dec |
|---|---|---|---|---|---|---|---|---|---|---|---|---|
| 2005 | 8,295 | 3,777 | 5,559 | 11,957 | 8,603 | 7,109 | 9,290 | 5,364 | 8,441 | 3,183 | 5,023 | 5,764 |
| 2006 | 9,504 | 5,864 | 1,685 | -9,411 | -9,016 | -10,006 | -8,508 | -6,000 | -6,956 | -12,448 | -11,905 | -10,578 |
| 2007 | -6,377 | -5,814 | -9,152 | -6,221 | -2,822 | -2,743 | -6,561 | -5,509 | -8,121 | -9,303 | -10,094 | -9,082 |
| 2008 | -7,533 | -5,350 | -4,578 | -4,471 | -11,256 | -9,161 | -9,001 | -10,409 | -7,409 | -11,008 | -13,863 | -14,468 |
| 2009 | -15,032 | -12,496 | -16,848 | -18,544 | -15,173 | -15,197 | -16,825 | -18,294 | -18,955 | -20,902 | -20,245 | -19,228 |
| 2010 | -25,750 | -24,050 | -23,604 | -24,420 | -24,994 | -23,048 | -25,681 | -25,646 | -22,662 | -25,900 | -24,990 | -25,864 |
| 2011 | -23,811 | -12,559 | -22,623 | -25,228 | -23,577 | -27,979 | -30,650 | -31,889 | -26,642 | -25,419 | -27,031 | -26,742 |
| 2012 | -29,316 | -32,504 | -33,561 | -30,292 | -33,707 | -35,726 | -33,938 | -33,306 | -35,355 | -35,348 | -33,182 | -37,193 |
| 2013 | -34,176 | -28,507 | -35,950 | -37,986 | -37,297 | -40,125 | -39,212 | -38,467 | -39,570 | -42,281 | -41,230 | -41,563 |
| 2014 | -38,771 | -30,178 | -38,158 | -40,156 | -38,704 | -39,697 | -41,257 | -43,995 | -42,826 | -48,590 | -45,824 | -39,887 |
| 2015 | -41,179 | -37,624 | -36,671 | -43,403 | -47,075 | -47,506 | -43,903 | -41,852 | -40,862 | -40,907 | -42,668 | -48,802 |
| 2016 | -44,575 | -42,747 | -46,310 | -42,301 | -44,730 | -42,737 | -46,583 | -47,095 | -45,301 | -45,761 | -47,667 | -50,676 |
| 2017 | -46,631 | -36,850 | -46,000 | -50,934 | -53,355 | -51,378 | -52,419 | -49,630 | -35,928 | -50,341 | -51,575 | -52,128 |
| 2018 | -52,091 | -52,098 | -56,186 | -47,937 | -51,756 | -53,645 | -50,999 | -52,478 | -49,336 | -52,041 | -50,674 | -52,702 |
| 2019 | -48,381 | -42,363 | -45,106 | -48,054 | -51,926 | -48,559 | -50,246 | -53,897 | -48,441 | -50,861 | -52,225 | -52,066 |
| 2020 | -53,407 | -47,778 | -48,518 | -38,671 | -41,735 | -44,478 | -47,095 | -42,222 | -45,107 | -51,122 | -48,866 | -49,931 |
| 2021 | -51,278 | -27,716 | -46,562 | -47,389 | -50,450 | -48,638 | -48,332 | -51,018 | -51,079 | -56,695 | -58,346 | -57,009 |
| 2022 | -54,402 | -48,415 | -56,314 | -52,990 | -53,483 | -53,161 | -54,167 | -55,781 | -53,074 | -56,095 | -53,520 | -50,801 |
| 2023 | -52,175 | -46,137 | -49,178 | -51,813 | -56,567 | -55,489 | -57,820 | -59,281 | -55,733 | -57,766 | -57,729 | -58,817 |
| 2024 | -51,051 | -50,647 | ||||||||||
| - = No Data Reported; -- = Not Applicable; NA = Not Available; W = Withheld to avoid disclosure of individual company data. |
| Release Date: 4/30/2024 |
| Next Release Date: 5/31/2024 |
Referring Pages: