|
Download Data (XLS File) |
|
||||||||
|
||||||||
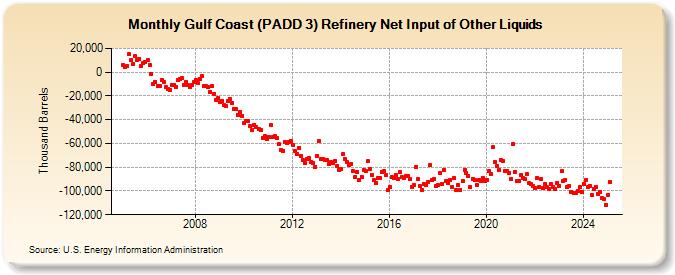
| Gulf Coast (PADD 3) Refinery Net Input of Other Liquids (Thousand Barrels) | ||||||||
| Year | Jan | Feb | Mar | Apr | May | Jun | Jul | Aug | Sep | Oct | Nov | Dec |
|---|---|---|---|---|---|---|---|---|---|---|---|---|
| 2005 | 5,659 | 4,711 | 5,313 | 14,954 | 10,165 | 7,052 | 13,350 | 9,820 | 10,987 | 5,409 | 7,647 | 8,643 |
| 2006 | 9,844 | 6,378 | -1,182 | -9,691 | -8,034 | -11,815 | -11,823 | -7,025 | -8,066 | -12,661 | -13,997 | -14,657 |
| 2007 | -10,880 | -10,849 | -12,140 | -6,484 | -5,405 | -5,230 | -10,586 | -8,080 | -11,197 | -12,246 | -10,904 | -8,422 |
| 2008 | -6,465 | -9,441 | -5,893 | -3,135 | -12,047 | -11,937 | -12,786 | -16,796 | -11,786 | -18,105 | -23,311 | -21,873 |
| 2009 | -25,404 | -24,139 | -27,824 | -28,605 | -23,877 | -22,770 | -25,882 | -31,039 | -31,138 | -36,188 | -33,793 | -36,493 |
| 2010 | -42,884 | -41,073 | -41,159 | -45,327 | -48,612 | -44,416 | -46,033 | -48,152 | -49,071 | -55,152 | -54,027 | -56,120 |
| 2011 | -54,381 | -44,890 | -54,837 | -53,731 | -55,695 | -60,784 | -65,110 | -66,054 | -58,536 | -59,228 | -58,764 | -57,769 |
| 2012 | -61,009 | -66,340 | -68,911 | -63,746 | -70,368 | -74,304 | -76,516 | -72,821 | -72,619 | -75,324 | -76,891 | -79,546 |
| 2013 | -70,596 | -57,617 | -73,385 | -73,205 | -73,862 | -74,350 | -77,229 | -75,926 | -76,074 | -74,741 | -79,080 | -82,668 |
| 2014 | -81,603 | -68,747 | -73,326 | -75,675 | -78,541 | -77,104 | -83,326 | -87,905 | -83,960 | -90,627 | -87,882 | -82,223 |
| 2015 | -83,074 | -74,943 | -81,668 | -86,293 | -91,043 | -93,148 | -89,400 | -88,851 | -84,133 | -83,586 | -86,885 | -99,485 |
| 2016 | -96,597 | -88,093 | -89,241 | -86,231 | -89,939 | -84,231 | -88,324 | -89,075 | -87,609 | -87,733 | -90,192 | -96,394 |
| 2017 | -94,932 | -79,606 | -90,270 | -95,984 | -99,091 | -94,075 | -95,024 | -92,172 | -78,465 | -91,086 | -89,909 | -95,495 |
| 2018 | -95,097 | -84,779 | -94,339 | -82,245 | -91,383 | -93,603 | -90,709 | -96,302 | -89,170 | -99,586 | -95,115 | -99,031 |
| 2019 | -91,797 | -82,308 | -85,071 | -87,800 | -96,693 | -89,687 | -91,033 | -94,630 | -90,822 | -91,634 | -88,773 | -91,364 |
| 2020 | -90,682 | -83,427 | -86,009 | -63,396 | -76,002 | -79,143 | -82,672 | -73,606 | -75,201 | -83,373 | -82,905 | -84,488 |
| 2021 | -89,617 | -60,272 | -83,746 | -91,821 | -91,678 | -86,711 | -89,432 | -90,043 | -85,991 | -93,543 | -94,406 | -95,823 |
| 2022 | -97,932 | -88,789 | -96,934 | -90,074 | -97,921 | -93,852 | -97,052 | -98,345 | -94,295 | -96,819 | -98,405 | -93,602 |
| 2023 | -95,666 | -83,464 | -91,246 | -90,809 | -96,543 | -95,352 | -100,498 | -101,365 | -101,436 | -99,554 | -96,590 | -101,255 |
| 2024 | -93,951 | |||||||||||
| - = No Data Reported; -- = Not Applicable; NA = Not Available; W = Withheld to avoid disclosure of individual company data. |
| Release Date: 3/29/2024 |
| Next Release Date: 4/30/2024 |
Referring Pages: