|
Download Data (XLS File) |
|
||||||||
|
||||||||
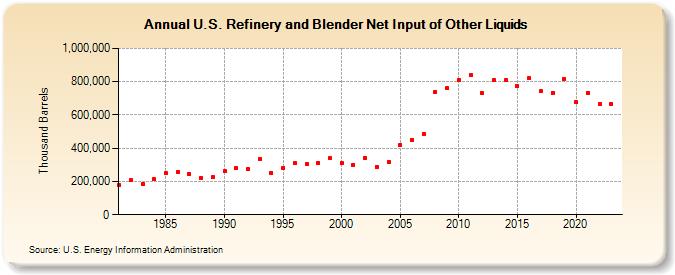
| U.S. Refinery and Blender Net Input of Other Liquids (Thousand Barrels) | ||||||||
| Decade | Year-0 | Year-1 | Year-2 | Year-3 | Year-4 | Year-5 | Year-6 | Year-7 | Year-8 | Year-9 |
|---|---|---|---|---|---|---|---|---|---|---|
| 1980's | 178,237 | 208,679 | 184,321 | 212,763 | 248,624 | 259,672 | 243,600 | 223,309 | 223,797 | |
| 1990's | 260,108 | 280,265 | 272,676 | 334,684 | 252,283 | 282,984 | 308,415 | 303,557 | 311,257 | 338,445 |
| 2000's | 310,696 | 301,221 | 343,516 | 288,614 | 316,838 | 419,515 | 451,824 | 488,020 | 739,047 | 760,043 |
| 2010's | 809,799 | 839,479 | 730,907 | 806,959 | 808,104 | 773,432 | 819,058 | 741,289 | 733,949 | 816,353 |
| 2020's | 675,554 | 734,038 | 663,981 | 667,389 |
| - = No Data Reported; -- = Not Applicable; NA = Not Available; W = Withheld to avoid disclosure of individual company data. |
| Release Date: 3/29/2024 |
| Next Release Date: 8/30/2024 |