|
Download Data (XLS File) |
|
||||||||
|
||||||||
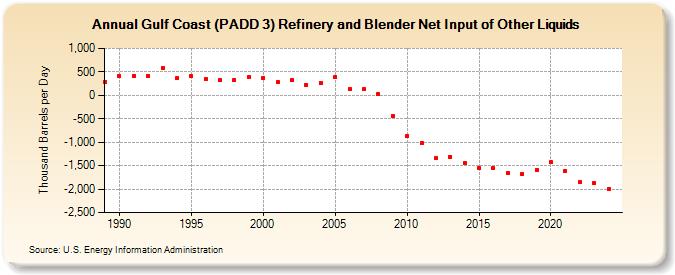
| Gulf Coast (PADD 3) Refinery and Blender Net Input of Other Liquids (Thousand Barrels per Day) | ||||||||
| Decade | Year-0 | Year-1 | Year-2 | Year-3 | Year-4 | Year-5 | Year-6 | Year-7 | Year-8 | Year-9 |
|---|---|---|---|---|---|---|---|---|---|---|
| 1980's | 293 | |||||||||
| 1990's | 409 | 418 | 407 | 578 | 365 | 404 | 352 | 324 | 330 | 385 |
| 2000's | 379 | 285 | 325 | 222 | 272 | 394 | 137 | 127 | 27 | -444 |
| 2010's | -859 | -1,021 | -1,344 | -1,306 | -1,439 | -1,556 | -1,557 | -1,655 | -1,675 | -1,592 |
| 2020's | -1,429 | -1,606 | -1,855 | -1,872 |
| - = No Data Reported; -- = Not Applicable; NA = Not Available; W = Withheld to avoid disclosure of individual company data. |
| Release Date: 8/30/2024 |
| Next Release Date: 8/29/2025 |