|
Download Data (XLS File) |
|
||||||||
|
||||||||
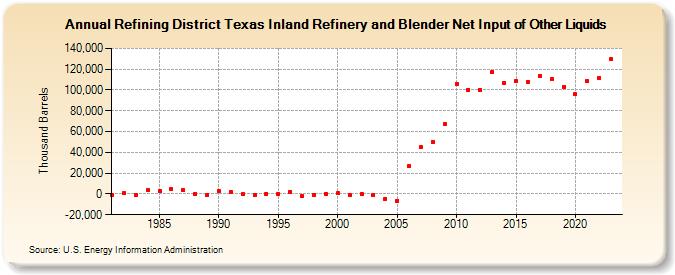
| Refining District Texas Inland Refinery and Blender Net Input of Other Liquids (Thousand Barrels) | ||||||||
| Decade | Year-0 | Year-1 | Year-2 | Year-3 | Year-4 | Year-5 | Year-6 | Year-7 | Year-8 | Year-9 |
|---|---|---|---|---|---|---|---|---|---|---|
| 1980's | -982 | 845 | -699 | 3,403 | 2,382 | 4,678 | 3,702 | 38 | -1,024 | |
| 1990's | 2,480 | 1,902 | -282 | -596 | 328 | -30 | 2,139 | -1,954 | -572 | -6 |
| 2000's | 449 | -1,093 | 130 | -1,184 | -4,830 | -6,534 | 26,839 | 44,922 | 50,061 | 66,974 |
| 2010's | 105,528 | 100,334 | 100,296 | 117,258 | 106,949 | 108,494 | 107,927 | 113,511 | 110,420 | 103,306 |
| 2020's | 95,831 | 108,867 | 111,772 | 129,647 |
| - = No Data Reported; -- = Not Applicable; NA = Not Available; W = Withheld to avoid disclosure of individual company data. |
| Release Date: 3/29/2024 |
| Next Release Date: 8/30/2024 |