|
Download Data (XLS File) |
|
||||||||
|
||||||||
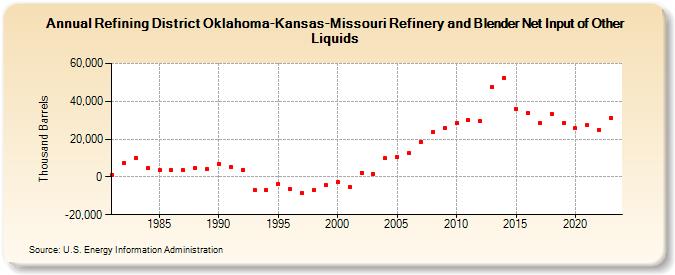
| Refining District Oklahoma-Kansas-Missouri Refinery and Blender Net Input of Other Liquids (Thousand Barrels) | ||||||||
| Decade | Year-0 | Year-1 | Year-2 | Year-3 | Year-4 | Year-5 | Year-6 | Year-7 | Year-8 | Year-9 |
|---|---|---|---|---|---|---|---|---|---|---|
| 1980's | 1,125 | 7,415 | 10,174 | 4,496 | 3,568 | 3,434 | 3,511 | 4,726 | 4,221 | |
| 1990's | 6,833 | 5,152 | 3,686 | -6,925 | -7,040 | -3,831 | -6,520 | -8,441 | -6,715 | -4,507 |
| 2000's | -2,521 | -5,086 | 2,255 | 1,497 | 9,755 | 10,652 | 12,436 | 18,447 | 23,644 | 25,987 |
| 2010's | 28,377 | 30,168 | 29,350 | 47,492 | 52,560 | 35,871 | 34,041 | 28,519 | 33,440 | 28,740 |
| 2020's | 25,677 | 27,265 | 24,827 | 31,381 |
| - = No Data Reported; -- = Not Applicable; NA = Not Available; W = Withheld to avoid disclosure of individual company data. |
| Release Date: 3/29/2024 |
| Next Release Date: 8/30/2024 |