|
Download Data (XLS File) |
|
||||||||
|
||||||||
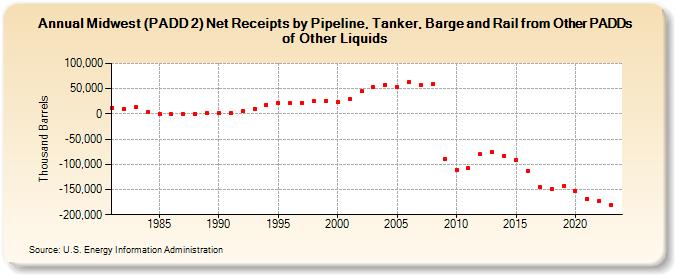
| Midwest (PADD 2) Net Receipts by Pipeline, Tanker, Barge and Rail from Other PADDs of Other Liquids (Thousand Barrels) | ||||||||
| Decade | Year-0 | Year-1 | Year-2 | Year-3 | Year-4 | Year-5 | Year-6 | Year-7 | Year-8 | Year-9 |
|---|---|---|---|---|---|---|---|---|---|---|
| 1980's | 12,111 | 10,467 | 12,760 | 3,082 | -409 | -1,152 | -996 | -67 | 1,552 | |
| 1990's | 1,199 | 1,577 | 4,781 | 10,226 | 18,346 | 21,813 | 20,773 | 21,838 | 24,971 | 26,211 |
| 2000's | 23,843 | 29,916 | 45,039 | 52,707 | 58,052 | 53,125 | 63,102 | 56,524 | 58,626 | -89,651 |
| 2010's | -111,216 | -108,108 | -80,296 | -75,715 | -82,934 | -91,715 | -113,101 | -144,926 | -149,182 | -143,862 |
| 2020's | -152,657 | -169,067 | -172,714 | -180,820 |
| - = No Data Reported; -- = Not Applicable; NA = Not Available; W = Withheld to avoid disclosure of individual company data. |
| Release Date: 3/29/2024 |
| Next Release Date: 8/30/2024 |