|
Download Data (XLS File) |
|
||||||||
|
||||||||
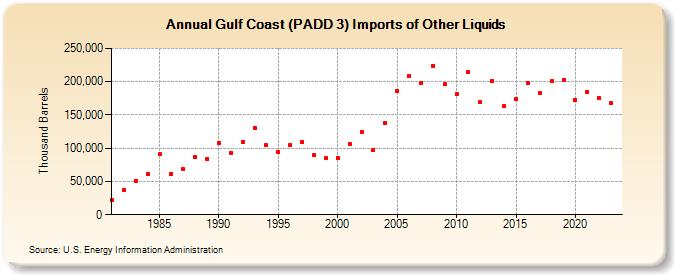
| Gulf Coast (PADD 3) Imports of Other Liquids (Thousand Barrels) | ||||||||
| Decade | Year-0 | Year-1 | Year-2 | Year-3 | Year-4 | Year-5 | Year-6 | Year-7 | Year-8 | Year-9 |
|---|---|---|---|---|---|---|---|---|---|---|
| 1980's | 21,529 | 37,442 | 51,061 | 60,850 | 91,085 | 60,836 | 68,361 | 86,418 | 84,390 | |
| 1990's | 107,642 | 93,449 | 109,165 | 130,633 | 104,149 | 93,853 | 104,677 | 109,162 | 89,995 | 84,773 |
| 2000's | 85,589 | 105,596 | 123,702 | 98,010 | 138,280 | 185,937 | 207,852 | 198,253 | 223,659 | 195,988 |
| 2010's | 181,900 | 214,601 | 168,728 | 201,439 | 163,317 | 173,364 | 197,827 | 182,932 | 200,503 | 202,973 |
| 2020's | 172,253 | 184,877 | 175,383 | 168,478 |
| - = No Data Reported; -- = Not Applicable; NA = Not Available; W = Withheld to avoid disclosure of individual company data. |
| Release Date: 3/29/2024 |
| Next Release Date: 8/30/2024 |