|
Download Data (XLS File) |
|
||||||||
|
||||||||
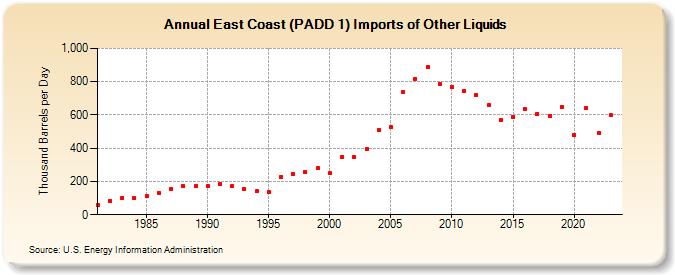
| East Coast (PADD 1) Imports of Other Liquids (Thousand Barrels per Day) | ||||||||
| Decade | Year-0 | Year-1 | Year-2 | Year-3 | Year-4 | Year-5 | Year-6 | Year-7 | Year-8 | Year-9 |
|---|---|---|---|---|---|---|---|---|---|---|
| 1980's | 58 | 84 | 102 | 101 | 112 | 132 | 153 | 172 | 172 | |
| 1990's | 173 | 184 | 174 | 152 | 140 | 138 | 229 | 243 | 254 | 278 |
| 2000's | 248 | 348 | 346 | 394 | 507 | 526 | 736 | 816 | 889 | 785 |
| 2010's | 769 | 745 | 717 | 659 | 572 | 590 | 637 | 607 | 596 | 648 |
| 2020's | 481 | 640 | 491 | 598 |
| - = No Data Reported; -- = Not Applicable; NA = Not Available; W = Withheld to avoid disclosure of individual company data. |
| Release Date: 3/29/2024 |
| Next Release Date: 8/30/2024 |