|
Download Data (XLS File) |
|
||||||||
|
||||||||
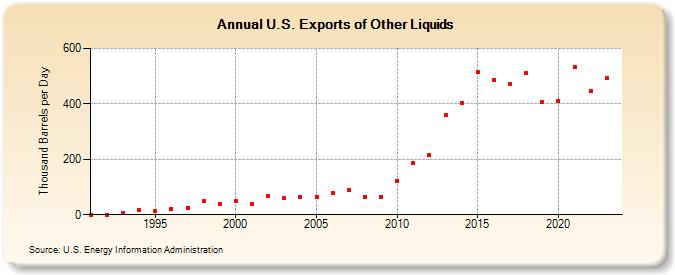
| U.S. Exports of Other Liquids (Thousand Barrels per Day) | ||||||||
| Decade | Year-0 | Year-1 | Year-2 | Year-3 | Year-4 | Year-5 | Year-6 | Year-7 | Year-8 | Year-9 |
|---|---|---|---|---|---|---|---|---|---|---|
| 1990's | 0 | 0 | 7 | 16 | 13 | 22 | 25 | 50 | 40 | |
| 2000's | 49 | 37 | 66 | 59 | 63 | 64 | 80 | 88 | 64 | 65 |
| 2010's | 122 | 186 | 214 | 359 | 404 | 514 | 486 | 470 | 512 | 407 |
| 2020's | 409 | 533 | 447 | 492 |
| - = No Data Reported; -- = Not Applicable; NA = Not Available; W = Withheld to avoid disclosure of individual company data. |
| Release Date: 3/29/2024 |
| Next Release Date: 8/30/2024 |