|
Download Data (XLS File) |
|
||||||||
|
||||||||
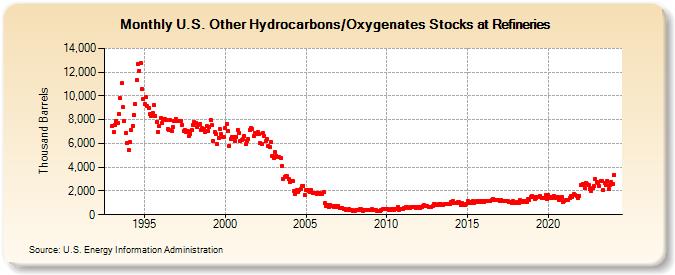
| U.S. Other Hydrocarbons/Oxygenates Stocks at Refineries (Thousand Barrels) | ||||||||
| Year | Jan | Feb | Mar | Apr | May | Jun | Jul | Aug | Sep | Oct | Nov | Dec |
|---|---|---|---|---|---|---|---|---|---|---|---|---|
| 1993 | 7,447 | 6,942 | 7,580 | 7,895 | 7,724 | 8,502 | 9,802 | 11,058 | 9,026 | 7,848 | 6,859 | 6,035 |
| 1994 | 5,450 | 6,085 | 7,141 | 7,491 | 8,388 | 9,299 | 11,331 | 12,727 | 12,126 | 12,775 | 10,593 | 9,759 |
| 1995 | 9,289 | 9,883 | 9,111 | 8,942 | 8,454 | 8,345 | 8,575 | 9,200 | 8,349 | 7,826 | 6,964 | 7,439 |
| 1996 | 8,155 | 7,758 | 8,087 | 8,039 | 7,992 | 7,216 | 7,157 | 7,957 | 7,016 | 7,373 | 7,858 | 8,071 |
| 1997 | 7,929 | 7,915 | 7,918 | 7,891 | 7,580 | 7,054 | 7,134 | 6,968 | 7,040 | 6,600 | 6,832 | 7,155 |
| 1998 | 7,568 | 7,768 | 7,753 | 7,358 | 7,586 | 7,649 | 7,101 | 7,271 | 7,220 | 6,951 | 7,430 | 7,059 |
| 1999 | 7,397 | 7,997 | 7,555 | 6,196 | 6,926 | 6,767 | 5,972 | 6,484 | 7,174 | 6,752 | 6,577 | 6,568 |
| 2000 | 7,282 | 7,626 | 7,013 | 5,801 | 6,378 | 6,557 | 6,552 | 6,216 | 6,576 | 7,143 | 6,914 | 6,186 |
| 2001 | 6,291 | 6,373 | 6,613 | 5,929 | 6,241 | 6,414 | 7,124 | 7,288 | 7,216 | 6,590 | 6,879 | 6,765 |
| 2002 | 6,950 | 6,809 | 5,997 | 5,960 | 6,852 | 6,634 | 6,165 | 6,361 | 5,816 | 5,692 | 6,102 | 4,974 |
| 2003 | 4,800 | 5,248 | 4,964 | 4,869 | 4,840 | 4,802 | 4,126 | 3,032 | 3,207 | 3,265 | 3,220 | 2,978 |
| 2004 | 2,769 | 2,871 | 2,841 | 2,012 | 1,779 | 2,058 | 1,927 | 2,076 | 2,145 | 2,406 | 2,438 | 1,649 |
| 2005 | 2,062 | 2,109 | 1,969 | 1,922 | 2,079 | 1,837 | 1,825 | 1,835 | 1,785 | 1,853 | 1,816 | 1,766 |
| 2006 | 1,757 | 1,885 | 972 | 707 | 848 | 617 | 806 | 717 | 729 | 660 | 717 | 664 |
| 2007 | 736 | 532 | 535 | 554 | 485 | 469 | 414 | 432 | 468 | 384 | 362 | 345 |
| 2008 | 334 | 371 | 358 | 399 | 454 | 450 | 280 | 369 | 395 | 430 | 408 | 396 |
| 2009 | 419 | 470 | 421 | 381 | 370 | 342 | 319 | 325 | 399 | 465 | 459 | 473 |
| 2010 | 517 | 473 | 435 | 433 | 499 | 425 | 455 | 490 | 629 | 434 | 486 | 498 |
| 2011 | 513 | 568 | 630 | 624 | 538 | 591 | 628 | 622 | 627 | 627 | 598 | 661 |
| 2012 | 660 | 599 | 625 | 744 | 795 | 747 | 773 | 629 | 655 | 640 | 739 | 904 |
| 2013 | 870 | 783 | 805 | 869 | 881 | 847 | 856 | 900 | 921 | 892 | 901 | 860 |
| 2014 | 1,066 | 1,117 | 1,006 | 982 | 958 | 1,034 | 1,045 | 832 | 955 | 829 | 832 | 925 |
| 2015 | 1,118 | 985 | 1,059 | 985 | 1,142 | 1,017 | 1,081 | 1,115 | 1,100 | 1,149 | 1,102 | 1,127 |
| 2016 | 1,068 | 1,172 | 1,161 | 1,186 | 1,153 | 1,128 | 1,237 | 1,338 | 1,222 | 1,272 | 1,228 | 1,261 |
| 2017 | 1,174 | 1,271 | 1,135 | 1,190 | 1,181 | 1,159 | 1,125 | 1,032 | 1,060 | 974 | 1,130 | 1,009 |
| 2018 | 995 | 1,087 | 991 | 1,230 | 1,176 | 1,081 | 1,140 | 1,142 | 1,068 | 1,329 | 1,241 | 1,497 |
| 2019 | 1,572 | 1,474 | 1,334 | 1,433 | 1,519 | 1,497 | 1,582 | 1,406 | 1,384 | 1,378 | 1,644 | 1,348 |
| 2020 | 1,696 | 1,403 | 1,507 | 1,429 | 1,602 | 1,494 | 1,414 | 1,529 | 1,272 | 1,352 | 1,520 | 1,078 |
| 2021 | 1,194 | 1,227 | 1,209 | 1,268 | 1,380 | 1,575 | 1,516 | 1,729 | 1,647 | 1,575 | 1,432 | 1,600 |
| 2022 | 2,502 | 2,460 | 2,615 | 2,261 | 2,700 | 2,579 | 2,479 | 2,174 | 2,037 | 2,235 | 2,398 | 2,992 |
| 2023 | 2,739 | 2,668 | 2,411 | 2,848 | 2,805 | 2,075 | 2,695 | 2,532 | 2,876 | 2,143 | 2,490 | 2,777 |
| 2024 | 2,559 | |||||||||||
| - = No Data Reported; -- = Not Applicable; NA = Not Available; W = Withheld to avoid disclosure of individual company data. |
| Release Date: 3/29/2024 |
| Next Release Date: 4/30/2024 |