|
Download Data (XLS File) |
|
||||||||
|
||||||||
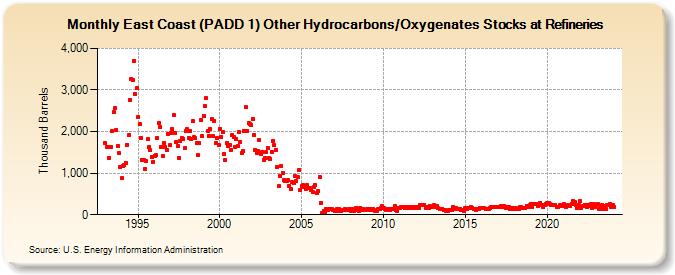
| East Coast (PADD 1) Other Hydrocarbons/Oxygenates Stocks at Refineries (Thousand Barrels) | ||||||||
| Year | Jan | Feb | Mar | Apr | May | Jun | Jul | Aug | Sep | Oct | Nov | Dec |
|---|---|---|---|---|---|---|---|---|---|---|---|---|
| 1993 | 1,721 | 1,636 | 1,629 | 1,372 | 1,630 | 2,002 | 2,460 | 2,555 | 2,041 | 1,658 | 1,475 | 1,152 |
| 1994 | 872 | 1,160 | 1,201 | 1,249 | 1,685 | 1,907 | 2,761 | 3,267 | 3,239 | 3,707 | 2,907 | 3,036 |
| 1995 | 2,359 | 2,174 | 1,856 | 1,317 | 1,314 | 1,111 | 1,281 | 1,809 | 1,617 | 1,549 | 1,385 | 1,272 |
| 1996 | 1,407 | 1,435 | 1,839 | 2,203 | 2,116 | 1,638 | 1,408 | 1,721 | 1,624 | 1,559 | 1,951 | 1,666 |
| 1997 | 1,972 | 2,067 | 2,392 | 1,969 | 1,745 | 1,658 | 1,370 | 1,767 | 1,856 | 1,827 | 1,598 | 2,017 |
| 1998 | 2,051 | 1,850 | 2,005 | 1,813 | 2,243 | 1,859 | 1,847 | 1,718 | 1,426 | 1,722 | 2,266 | 1,883 |
| 1999 | 2,381 | 2,605 | 2,795 | 2,016 | 1,893 | 2,066 | 2,292 | 1,893 | 2,255 | 1,720 | 1,841 | 1,678 |
| 2000 | 2,066 | 1,878 | 1,985 | 1,472 | 1,320 | 1,722 | 1,664 | 1,668 | 1,562 | 1,921 | 1,869 | 1,621 |
| 2001 | 1,823 | 1,647 | 1,983 | 1,748 | 1,486 | 1,527 | 2,006 | 2,579 | 2,010 | 2,198 | 2,188 | 2,156 |
| 2002 | 2,312 | 1,928 | 1,561 | 1,487 | 1,532 | 1,801 | 1,459 | 1,507 | 1,311 | 1,362 | 1,502 | 1,606 |
| 2003 | 1,366 | 1,351 | 1,517 | 1,767 | 1,667 | 1,557 | 1,157 | 680 | 921 | 1,169 | 1,014 | 833 |
| 2004 | 810 | 817 | 823 | 694 | 608 | 780 | 769 | 920 | 810 | 899 | 1,077 | 604 |
| 2005 | 689 | 708 | 678 | 625 | 707 | 653 | 652 | 593 | 553 | 677 | 711 | 512 |
| 2006 | 576 | 910 | 284 | 36 | 79 | 77 | 130 | 115 | 135 | 128 | 131 | 113 |
| 2007 | 81 | 80 | 131 | 143 | 92 | 90 | 116 | 117 | 133 | 109 | 125 | 130 |
| 2008 | 98 | 139 | 100 | 115 | 160 | 144 | 87 | 165 | 115 | 126 | 125 | 120 |
| 2009 | 126 | 130 | 104 | 130 | 130 | 109 | 94 | 97 | 146 | 135 | 165 | 199 |
| 2010 | 166 | 148 | 125 | 130 | 138 | 121 | 130 | 128 | 204 | 109 | 97 | 165 |
| 2011 | 154 | 183 | 195 | 180 | 152 | 194 | 165 | 181 | 165 | 180 | 156 | 189 |
| 2012 | 162 | 177 | 150 | 223 | 234 | 226 | 239 | 166 | 195 | 151 | 204 | 176 |
| 2013 | 175 | 225 | 185 | 220 | 154 | 147 | 135 | 141 | 125 | 124 | 93 | 100 |
| 2014 | 117 | 113 | 115 | 188 | 128 | 152 | 143 | 143 | 146 | 115 | 108 | 97 |
| 2015 | 161 | 148 | 163 | 161 | 180 | 165 | 142 | 141 | 114 | 146 | 146 | 157 |
| 2016 | 163 | 165 | 154 | 149 | 132 | 144 | 168 | 195 | 187 | 187 | 193 | 192 |
| 2017 | 197 | 196 | 198 | 184 | 202 | 197 | 166 | 185 | 182 | 140 | 158 | 145 |
| 2018 | 152 | 155 | 139 | 129 | 189 | 176 | 171 | 163 | 150 | 216 | 175 | 223 |
| 2019 | 263 | 186 | 255 | 247 | 246 | 215 | 257 | 283 | 231 | 175 | 243 | 267 |
| 2020 | 275 | 281 | 252 | 229 | 232 | 244 | 228 | 197 | 176 | 227 | 218 | 241 |
| 2021 | 250 | 210 | 191 | 224 | 198 | 216 | 262 | 318 | 296 | 234 | 158 | 232 |
| 2022 | 334 | 161 | 204 | 212 | 242 | 182 | 227 | 219 | 256 | 157 | 248 | 188 |
| 2023 | 239 | 262 | 133 | 172 | 231 | 137 | 217 | 148 | 241 | 238 | 246 | 178 |
| 2024 | 223 | |||||||||||
| - = No Data Reported; -- = Not Applicable; NA = Not Available; W = Withheld to avoid disclosure of individual company data. |
| Release Date: 3/29/2024 |
| Next Release Date: 4/30/2024 |