|
Download Data (XLS File) |
|
||||||||
|
||||||||
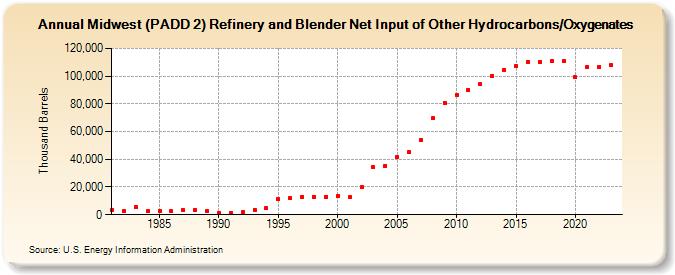
| Midwest (PADD 2) Refinery and Blender Net Input of Other Hydrocarbons/Oxygenates (Thousand Barrels) | ||||||||
| Decade | Year-0 | Year-1 | Year-2 | Year-3 | Year-4 | Year-5 | Year-6 | Year-7 | Year-8 | Year-9 |
|---|---|---|---|---|---|---|---|---|---|---|
| 1980's | 3,480 | 2,650 | 5,686 | 2,412 | 2,695 | 2,452 | 3,255 | 3,514 | 2,343 | |
| 1990's | 1,457 | 1,531 | 1,606 | 3,696 | 4,826 | 11,185 | 11,896 | 12,852 | 13,008 | 13,007 |
| 2000's | 13,747 | 12,547 | 19,797 | 34,214 | 35,433 | 41,770 | 45,200 | 54,044 | 69,536 | 80,940 |
| 2010's | 86,653 | 90,313 | 94,091 | 100,416 | 104,743 | 107,399 | 110,365 | 110,489 | 110,763 | 110,584 |
| 2020's | 99,121 | 106,695 | 106,776 | 107,995 |
| - = No Data Reported; -- = Not Applicable; NA = Not Available; W = Withheld to avoid disclosure of individual company data. |
| Release Date: 3/29/2024 |
| Next Release Date: 8/30/2024 |