|
Download Data (XLS File) |
|
||||||||
|
||||||||
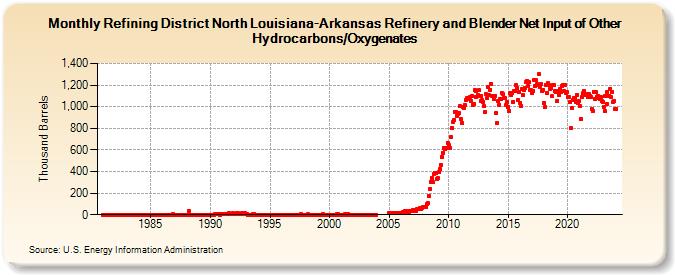
| Refining District North Louisiana-Arkansas Refinery and Blender Net Input of Other Hydrocarbons/Oxygenates (Thousand Barrels) | ||||||||
| Year | Jan | Feb | Mar | Apr | May | Jun | Jul | Aug | Sep | Oct | Nov | Dec |
|---|---|---|---|---|---|---|---|---|---|---|---|---|
| 1981 | 0 | 0 | 0 | 0 | 0 | 0 | 0 | 0 | 0 | 0 | 0 | 0 |
| 1982 | 0 | 0 | 0 | 0 | 0 | 0 | 0 | 0 | 0 | 0 | 0 | 0 |
| 1983 | 0 | 0 | 0 | 0 | 0 | 0 | 0 | 0 | 0 | 0 | 0 | 0 |
| 1984 | 0 | 0 | 0 | 0 | 0 | 0 | 0 | 0 | 0 | 0 | 0 | 0 |
| 1985 | 0 | 0 | 0 | 0 | 0 | 0 | 0 | 0 | 0 | 0 | 0 | 0 |
| 1986 | 0 | 0 | 0 | 0 | 0 | 0 | 0 | 0 | 0 | 0 | 2 | 0 |
| 1987 | 0 | 0 | 0 | 0 | 0 | 0 | 0 | 0 | 0 | 0 | 0 | 0 |
| 1988 | 0 | 0 | 37 | 0 | 0 | 0 | 0 | 0 | 0 | 0 | 0 | 0 |
| 1989 | 0 | 0 | 0 | 0 | 0 | 0 | 0 | 0 | 0 | 0 | 0 | 0 |
| 1990 | 0 | 0 | 0 | 0 | 0 | 2 | 2 | 3 | 2 | 2 | 1 | 2 |
| 1991 | 2 | 2 | 5 | 4 | 7 | 7 | 10 | 13 | 9 | 8 | 6 | 12 |
| 1992 | 9 | 9 | 11 | 15 | 13 | 10 | 10 | 11 | 16 | 12 | 11 | 12 |
| 1993 | 11 | 8 | 0 | 1 | 0 | 1 | 0 | 9 | 7 | 0 | 1 | 1 |
| 1994 | 0 | 0 | 0 | 0 | 0 | 1 | 0 | 0 | 0 | 0 | 0 | 0 |
| 1995 | 0 | 0 | 0 | 0 | 0 | 0 | 0 | 0 | 0 | 0 | 0 | 0 |
| 1996 | 0 | 0 | 0 | 1 | 0 | 0 | 0 | 0 | 0 | 0 | 1 | 1 |
| 1997 | 0 | 0 | 0 | 1 | 0 | 0 | 0 | 2 | 0 | 0 | 0 | 0 |
| 1998 | 0 | 0 | 2 | 1 | 0 | 0 | 0 | 1 | 1 | 1 | 1 | 0 |
| 1999 | 0 | 0 | 0 | 0 | 0 | 2 | 0 | 0 | 0 | 0 | 0 | 0 |
| 2000 | 0 | 0 | 0 | 0 | 1 | 0 | 0 | 2 | 6 | 0 | 0 | 0 |
| 2001 | 1 | 1 | 0 | 0 | 2 | 0 | 7 | 4 | 0 | 0 | 0 | 0 |
| 2002 | 0 | 0 | 0 | 0 | 0 | 0 | 0 | 0 | 0 | 0 | 0 | 0 |
| 2003 | 0 | 0 | 0 | 0 | 0 | 0 | 0 | 0 | 0 | 0 | 0 | 0 |
| 2005 | 16 | 16 | 19 | 19 | 18 | 20 | 20 | 20 | 19 | 19 | 17 | 17 |
| 2006 | 19 | 16 | 24 | 23 | 33 | 27 | 31 | 33 | 26 | 31 | 32 | 34 |
| 2007 | 43 | 39 | 43 | 35 | 49 | 49 | 55 | 60 | 55 | 62 | 71 | 73 |
| 2008 | 71 | 75 | 96 | 107 | 173 | 240 | 306 | 343 | 307 | 374 | 384 | 388 |
| 2009 | 326 | 339 | 394 | 422 | 463 | 536 | 572 | 616 | 606 | 622 | 614 | 667 |
| 2010 | 641 | 620 | 718 | 803 | 857 | 874 | 951 | 950 | 914 | 929 | 938 | 1,003 |
| 2011 | 887 | 850 | 995 | 984 | 1,020 | 1,060 | 1,078 | 1,075 | 1,067 | 1,089 | 1,052 | 1,100 |
| 2012 | 1,019 | 1,023 | 1,151 | 1,091 | 1,148 | 1,100 | 1,104 | 1,150 | 1,054 | 1,098 | 1,060 | 1,048 |
| 2013 | 1,006 | 952 | 1,115 | 1,084 | 1,185 | 1,104 | 1,159 | 1,210 | 1,100 | 1,099 | 1,068 | 1,101 |
| 2014 | 938 | 853 | 1,051 | 1,019 | 1,070 | 1,067 | 1,124 | 1,114 | 1,085 | 1,079 | 1,019 | 1,044 |
| 2015 | 1,000 | 961 | 1,128 | 1,104 | 1,127 | 1,048 | 1,143 | 1,141 | 1,197 | 1,175 | 1,061 | 1,136 |
| 2016 | 1,030 | 1,008 | 1,168 | 1,108 | 1,157 | 1,172 | 1,224 | 1,242 | 1,194 | 1,224 | 1,158 | 1,152 |
| 2017 | 1,124 | 1,146 | 1,246 | 1,187 | 1,243 | 1,207 | 1,200 | 1,298 | 1,178 | 1,212 | 1,149 | 1,155 |
| 2018 | 1,038 | 996 | 1,202 | 1,126 | 1,219 | 1,202 | 1,166 | 1,170 | 1,096 | 1,203 | 1,197 | 1,144 |
| 2019 | 1,140 | 1,056 | 1,144 | 1,104 | 1,168 | 1,138 | 1,196 | 1,205 | 1,145 | 1,200 | 1,126 | 1,136 |
| 2020 | 1,094 | 1,091 | 1,039 | 799 | 984 | 1,061 | 1,082 | 1,078 | 1,047 | 1,106 | 1,032 | 1,053 |
| 2021 | 1,006 | 884 | 1,089 | 1,124 | 1,148 | 1,108 | 1,115 | 1,118 | 1,086 | 1,115 | 1,099 | 1,094 |
| 2022 | 980 | 962 | 1,138 | 1,069 | 1,133 | 1,091 | 1,099 | 1,083 | 1,068 | 1,088 | 1,049 | 1,043 |
| 2023 | 1,000 | 956 | 1,099 | 1,026 | 1,137 | 1,098 | 1,103 | 1,168 | 1,088 | 1,136 | 1,046 | 1,053 |
| 2024 | 976 | 982 | ||||||||||
| - = No Data Reported; -- = Not Applicable; NA = Not Available; W = Withheld to avoid disclosure of individual company data. |
| Release Date: 4/30/2024 |
| Next Release Date: 5/31/2024 |