|
Download Data (XLS File) |
|
||||||||
|
||||||||
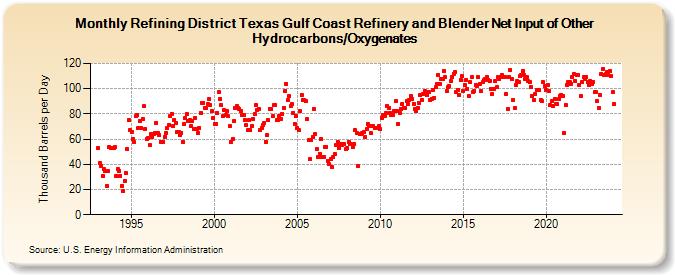
| Refining District Texas Gulf Coast Refinery and Blender Net Input of Other Hydrocarbons/Oxygenates (Thousand Barrels per Day) | ||||||||
| Year | Jan | Feb | Mar | Apr | May | Jun | Jul | Aug | Sep | Oct | Nov | Dec |
|---|---|---|---|---|---|---|---|---|---|---|---|---|
| 1993 | 53 | 41 | 39 | 31 | 36 | 35 | 23 | 35 | 54 | 53 | 53 | 53 |
| 1994 | 54 | 31 | 36 | 35 | 31 | 23 | 19 | 27 | 33 | 52 | 75 | 67 |
| 1995 | 66 | 60 | 58 | 78 | 79 | 69 | 74 | 69 | 76 | 86 | 68 | 60 |
| 1996 | 61 | 55 | 64 | 62 | 64 | 65 | 73 | 65 | 63 | 58 | 58 | 58 |
| 1997 | 62 | 65 | 69 | 71 | 78 | 80 | 70 | 75 | 73 | 66 | 66 | 63 |
| 1998 | 65 | 58 | 72 | 77 | 80 | 74 | 75 | 70 | 74 | 68 | 77 | 68 |
| 1999 | 65 | 69 | 81 | 89 | 89 | 85 | 85 | 88 | 92 | 87 | 82 | 77 |
| 2000 | 72 | 72 | 81 | 97 | 92 | 87 | 78 | 83 | 79 | 82 | 78 | 70 |
| 2001 | 58 | 60 | 74 | 85 | 86 | 85 | 84 | 82 | 79 | 79 | 75 | 71 |
| 2002 | 67 | 75 | 67 | 70 | 76 | 80 | 87 | 83 | 84 | 67 | 69 | 71 |
| 2003 | 73 | 58 | 63 | 75 | 84 | 84 | 78 | 87 | 87 | 75 | 75 | 78 |
| 2004 | 76 | 80 | 85 | 98 | 104 | 91 | 94 | 86 | 88 | 81 | 72 | 78 |
| 2005 | 69 | 67 | 82 | 95 | 91 | 91 | 90 | 76 | 59 | 44 | 59 | 62 |
| 2006 | 84 | 64 | 52 | 46 | 48 | 60 | 46 | 46 | 54 | 54 | 43 | 40 |
| 2007 | 44 | 38 | 46 | 48 | 55 | 58 | 53 | 56 | 55 | 56 | 56 | 52 |
| 2008 | 53 | 58 | 56 | 56 | 54 | 56 | 67 | 65 | 39 | 64 | 64 | 65 |
| 2009 | 66 | 62 | 68 | 72 | 70 | 65 | 70 | 70 | 69 | 69 | 69 | 70 |
| 2010 | 68 | 77 | 79 | 78 | 81 | 86 | 85 | 81 | 79 | 79 | 82 | 90 |
| 2011 | 82 | 72 | 81 | 84 | 88 | 85 | 85 | 90 | 88 | 91 | 94 | 92 |
| 2012 | 88 | 84 | 82 | 85 | 89 | 95 | 91 | 96 | 98 | 97 | 95 | 97 |
| 2013 | 91 | 92 | 99 | 93 | 101 | 104 | 111 | 104 | 108 | 108 | 114 | 109 |
| 2014 | 98 | 101 | 102 | 106 | 109 | 112 | 113 | 97 | 99 | 95 | 107 | 110 |
| 2015 | 98 | 103 | 107 | 100 | 94 | 105 | 109 | 97 | 98 | 103 | 102 | 109 |
| 2016 | 104 | 98 | 105 | 107 | 108 | 109 | 107 | 106 | 100 | 96 | 100 | 106 |
| 2017 | 101 | 109 | 108 | 109 | 111 | 109 | 109 | 96 | 84 | 109 | 115 | 108 |
| 2018 | 91 | 85 | 103 | 106 | 105 | 110 | 111 | 114 | 111 | 108 | 109 | 106 |
| 2019 | 105 | 101 | 94 | 91 | 96 | 99 | 99 | 99 | 91 | 90 | 105 | 102 |
| 2020 | 99 | 103 | 98 | 87 | 90 | 86 | 92 | 88 | 88 | 92 | 94 | 95 |
| 2021 | 94 | 65 | 87 | 103 | 105 | 105 | 104 | 109 | 112 | 106 | 111 | 111 |
| 2022 | 103 | 94 | 105 | 109 | 108 | 109 | 105 | 103 | 106 | 104 | 105 | 97 |
| 2023 | 97 | 90 | 85 | 95 | 112 | 116 | 111 | 112 | 113 | 111 | 114 | 110 |
| 2024 | 97 | |||||||||||
| - = No Data Reported; -- = Not Applicable; NA = Not Available; W = Withheld to avoid disclosure of individual company data. |
| Release Date: 3/29/2024 |
| Next Release Date: 4/30/2024 |