|
Download Data (XLS File) |
|
||||||||
|
||||||||
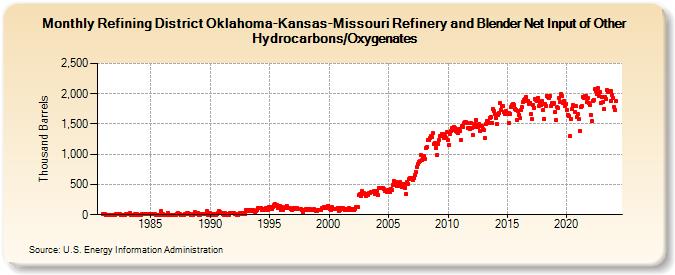
| Refining District Oklahoma-Kansas-Missouri Refinery and Blender Net Input of Other Hydrocarbons/Oxygenates (Thousand Barrels) | ||||||||
| Year | Jan | Feb | Mar | Apr | May | Jun | Jul | Aug | Sep | Oct | Nov | Dec |
|---|---|---|---|---|---|---|---|---|---|---|---|---|
| 1981 | 8 | 8 | 8 | 0 | 1 | 1 | 1 | 1 | 1 | 1 | 1 | 1 |
| 1982 | 0 | 8 | 12 | 9 | 7 | 9 | 0 | 0 | 0 | 0 | 0 | 14 |
| 1983 | 13 | 15 | 20 | 21 | 0 | 0 | 0 | 0 | 19 | 0 | 6 | 0 |
| 1984 | 0 | 0 | 0 | 6 | 6 | 13 | 6 | 20 | 4 | 5 | 4 | 5 |
| 1985 | 5 | 4 | 5 | 5 | 5 | 0 | 0 | 0 | 1 | 0 | 56 | 17 |
| 1986 | 7 | 0 | 1 | 0 | 0 | 35 | 1 | 0 | 2 | 0 | 0 | 0 |
| 1987 | 0 | 0 | 13 | 30 | 10 | 13 | 1 | 0 | 0 | 0 | 15 | 19 |
| 1988 | 23 | 11 | 24 | 11 | 10 | 0 | 0 | 0 | 17 | 38 | 25 | 13 |
| 1989 | 26 | 3 | 0 | 4 | 15 | 19 | 6 | 15 | 8 | 63 | 0 | 16 |
| 1990 | 29 | 0 | 13 | 0 | 5 | 1 | 0 | 5 | 26 | 54 | 47 | 29 |
| 1991 | 22 | 8 | 0 | 23 | 0 | 0 | 9 | 2 | 35 | 22 | 31 | 27 |
| 1992 | 29 | 4 | 5 | 0 | 0 | 12 | 27 | 32 | 14 | 33 | 5 | 5 |
| 1993 | 79 | 56 | 69 | 81 | 72 | 59 | 72 | 81 | 66 | 41 | 62 | 71 |
| 1994 | 115 | 105 | 118 | 117 | 86 | 86 | 94 | 84 | 111 | 98 | 79 | 129 |
| 1995 | 129 | 120 | 101 | 128 | 156 | 183 | 138 | 158 | 113 | 122 | 139 | 74 |
| 1996 | 121 | 82 | 108 | 113 | 122 | 146 | 117 | 115 | 115 | 93 | 83 | 87 |
| 1997 | 119 | 110 | 98 | 114 | 112 | 97 | 95 | 87 | 92 | 85 | 52 | 85 |
| 1998 | 81 | 92 | 98 | 84 | 90 | 94 | 76 | 73 | 76 | 88 | 70 | 63 |
| 1999 | 68 | 75 | 77 | 76 | 74 | 105 | 106 | 125 | 114 | 113 | 124 | 150 |
| 2000 | 107 | 95 | 75 | 121 | 96 | 95 | 96 | 89 | 98 | 111 | 65 | 84 |
| 2001 | 108 | 110 | 104 | 100 | 81 | 99 | 94 | 85 | 104 | 89 | 81 | 91 |
| 2002 | 93 | 83 | 91 | 123 | 134 | 125 | 321 | 336 | 303 | 388 | 351 | 356 |
| 2003 | 341 | 310 | 335 | 328 | 360 | 357 | 368 | 372 | 370 | 386 | 341 | 348 |
| 2004 | 395 | 322 | 449 | 442 | 436 | 436 | 448 | 417 | 395 | 398 | 383 | 411 |
| 2005 | 396 | 375 | 430 | 411 | 497 | 562 | 549 | 547 | 468 | 477 | 479 | 535 |
| 2006 | 498 | 451 | 473 | 509 | 514 | 446 | 346 | 547 | 511 | 591 | 608 | 602 |
| 2007 | 615 | 579 | 605 | 650 | 707 | 795 | 836 | 875 | 880 | 979 | 912 | 943 |
| 2008 | 965 | 925 | 1,099 | 1,127 | 1,233 | 1,240 | 1,264 | 1,300 | 1,287 | 1,350 | 1,172 | 1,191 |
| 2009 | 1,097 | 994 | 1,174 | 1,238 | 1,296 | 1,300 | 1,342 | 1,337 | 1,272 | 1,293 | 1,261 | 1,361 |
| 2010 | 1,233 | 1,160 | 1,340 | 1,377 | 1,432 | 1,405 | 1,456 | 1,435 | 1,376 | 1,369 | 1,352 | 1,423 |
| 2011 | 1,390 | 1,242 | 1,467 | 1,454 | 1,511 | 1,527 | 1,529 | 1,511 | 1,431 | 1,432 | 1,418 | 1,524 |
| 2012 | 1,435 | 1,325 | 1,453 | 1,495 | 1,572 | 1,453 | 1,443 | 1,493 | 1,387 | 1,466 | 1,467 | 1,417 |
| 2013 | 1,406 | 1,275 | 1,496 | 1,556 | 1,548 | 1,521 | 1,606 | 1,614 | 1,523 | 1,751 | 1,713 | 1,672 |
| 2014 | 1,599 | 1,498 | 1,652 | 1,681 | 1,842 | 1,737 | 1,789 | 1,805 | 1,694 | 1,673 | 1,666 | 1,711 |
| 2015 | 1,658 | 1,517 | 1,675 | 1,670 | 1,784 | 1,809 | 1,835 | 1,818 | 1,753 | 1,737 | 1,559 | 1,707 |
| 2016 | 1,654 | 1,602 | 1,738 | 1,775 | 1,855 | 1,903 | 1,920 | 1,946 | 1,872 | 1,883 | 1,824 | 1,852 |
| 2017 | 1,662 | 1,579 | 1,819 | 1,771 | 1,905 | 1,902 | 1,877 | 1,936 | 1,799 | 1,858 | 1,816 | 1,881 |
| 2018 | 1,736 | 1,587 | 1,835 | 1,803 | 1,968 | 1,938 | 1,934 | 1,956 | 1,796 | 1,843 | 1,831 | 1,840 |
| 2019 | 1,699 | 1,564 | 1,778 | 1,758 | 1,930 | 1,862 | 1,991 | 1,967 | 1,844 | 1,888 | 1,803 | 1,837 |
| 2020 | 1,732 | 1,647 | 1,627 | 1,294 | 1,578 | 1,742 | 1,811 | 1,804 | 1,705 | 1,789 | 1,622 | 1,658 |
| 2021 | 1,577 | 1,392 | 1,777 | 1,804 | 1,954 | 1,930 | 1,970 | 1,968 | 1,856 | 1,923 | 1,841 | 1,811 |
| 2022 | 1,655 | 1,542 | 1,886 | 1,897 | 2,070 | 2,046 | 1,998 | 2,088 | 1,962 | 2,022 | 1,846 | 1,941 |
| 2023 | 1,856 | 1,748 | 1,951 | 1,917 | 2,058 | 2,050 | 2,030 | 2,044 | 1,885 | 2,045 | 1,980 | 1,926 |
| 2024 | 1,775 | 1,735 | 1,872 | 1,927 | 2,021 | 1,984 | ||||||
| - = No Data Reported; -- = Not Applicable; NA = Not Available; W = Withheld to avoid disclosure of individual company data. |
| Release Date: 8/30/2024 |
| Next Release Date: 9/30/2024 |